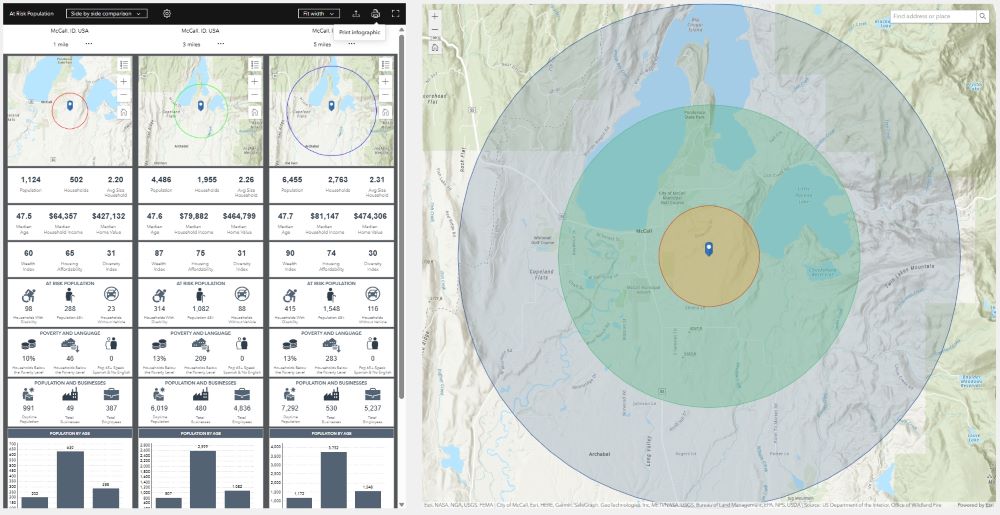
Some things to know about Business Analyst Widget in Experience Builder
The Business Analyst widget helps us visualize key indicators and data about locations using interactive infographics. These ready-to-use infographics can be used in ArcGIS Business Analyst Web App or ArcGIS Community Analyst with additional licensing, or you can...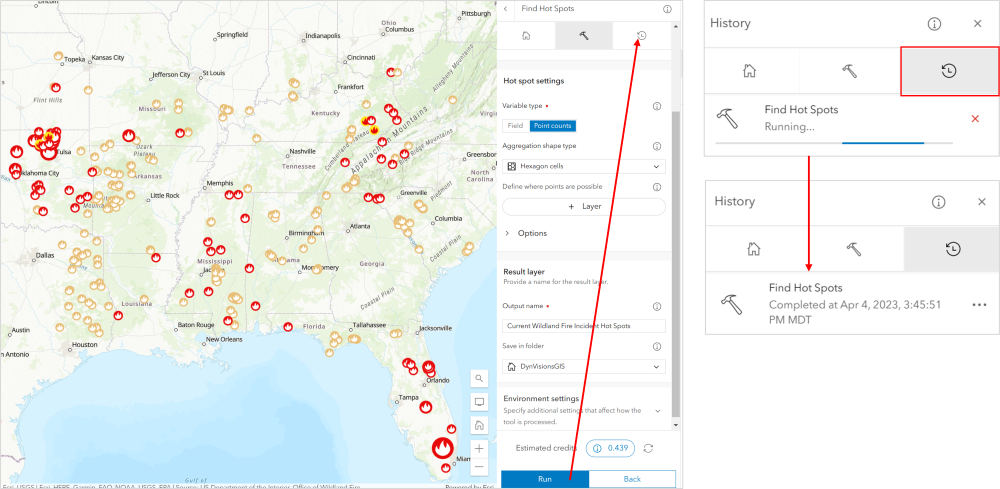
New Analysis Capabilities in ArcGIS Online Map Viewer (Find Hot Spots)
It has been rare that I have had to venture back into Map Viewer Classic from the new Map Viewer. For one thing, I haven’t wanted to because of the awesome functions and cartographic features available in the new Map Viewer. The most consistent reason for my...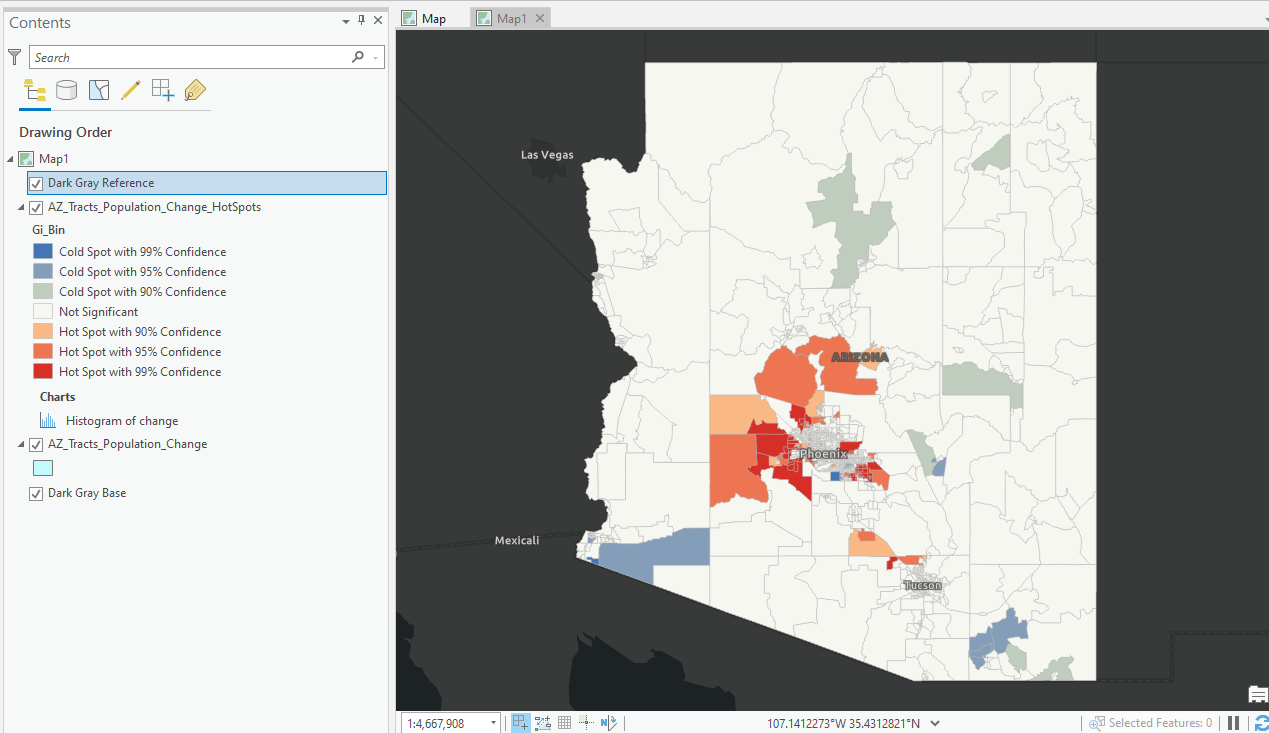
Mapping Population Growth Hot Spots with R and ArcGIS Pro
This tutorial demonstrates how to use R and ArcGIS Pro to generate hot spot maps of population growth by census tract. In a previous article I showed you how to use the tidycensus R package to quickly access and map US census data. You can also download a free copy of...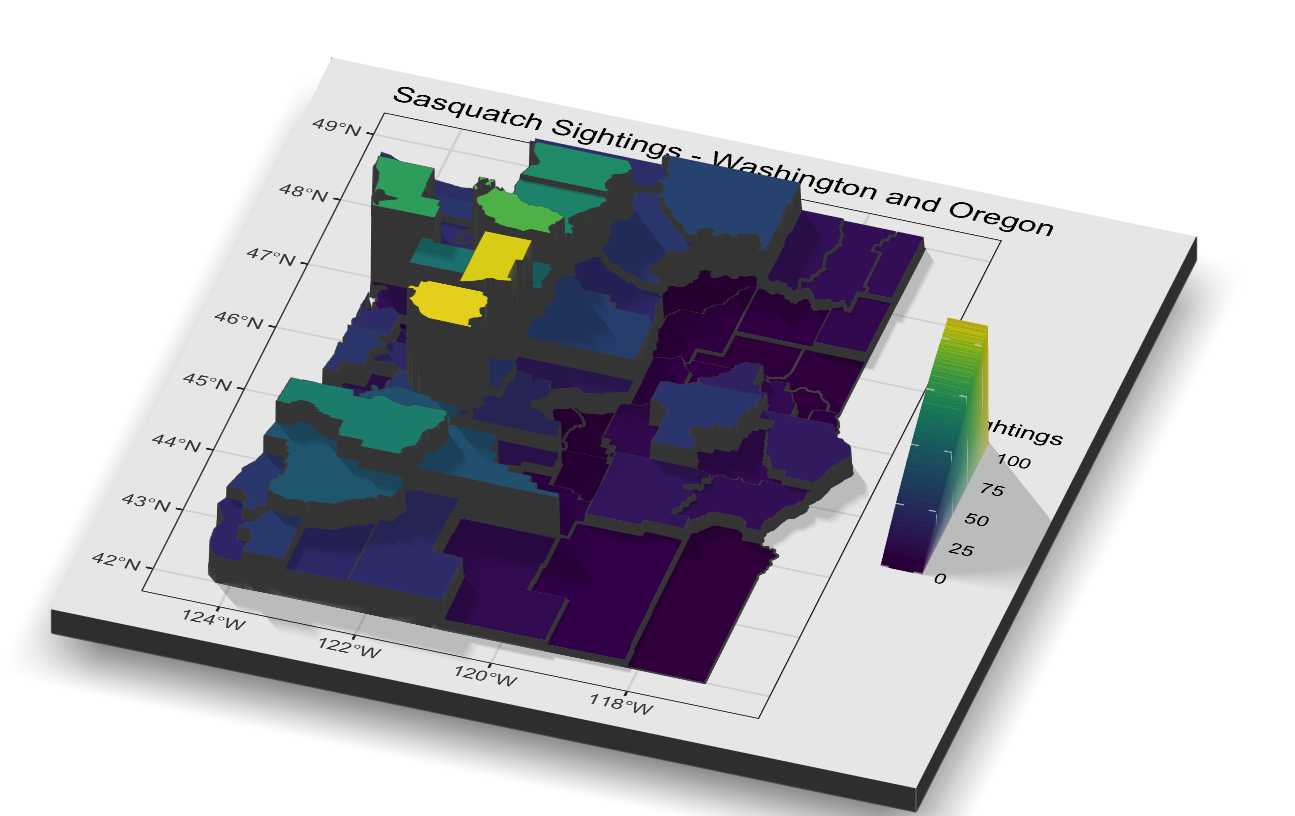
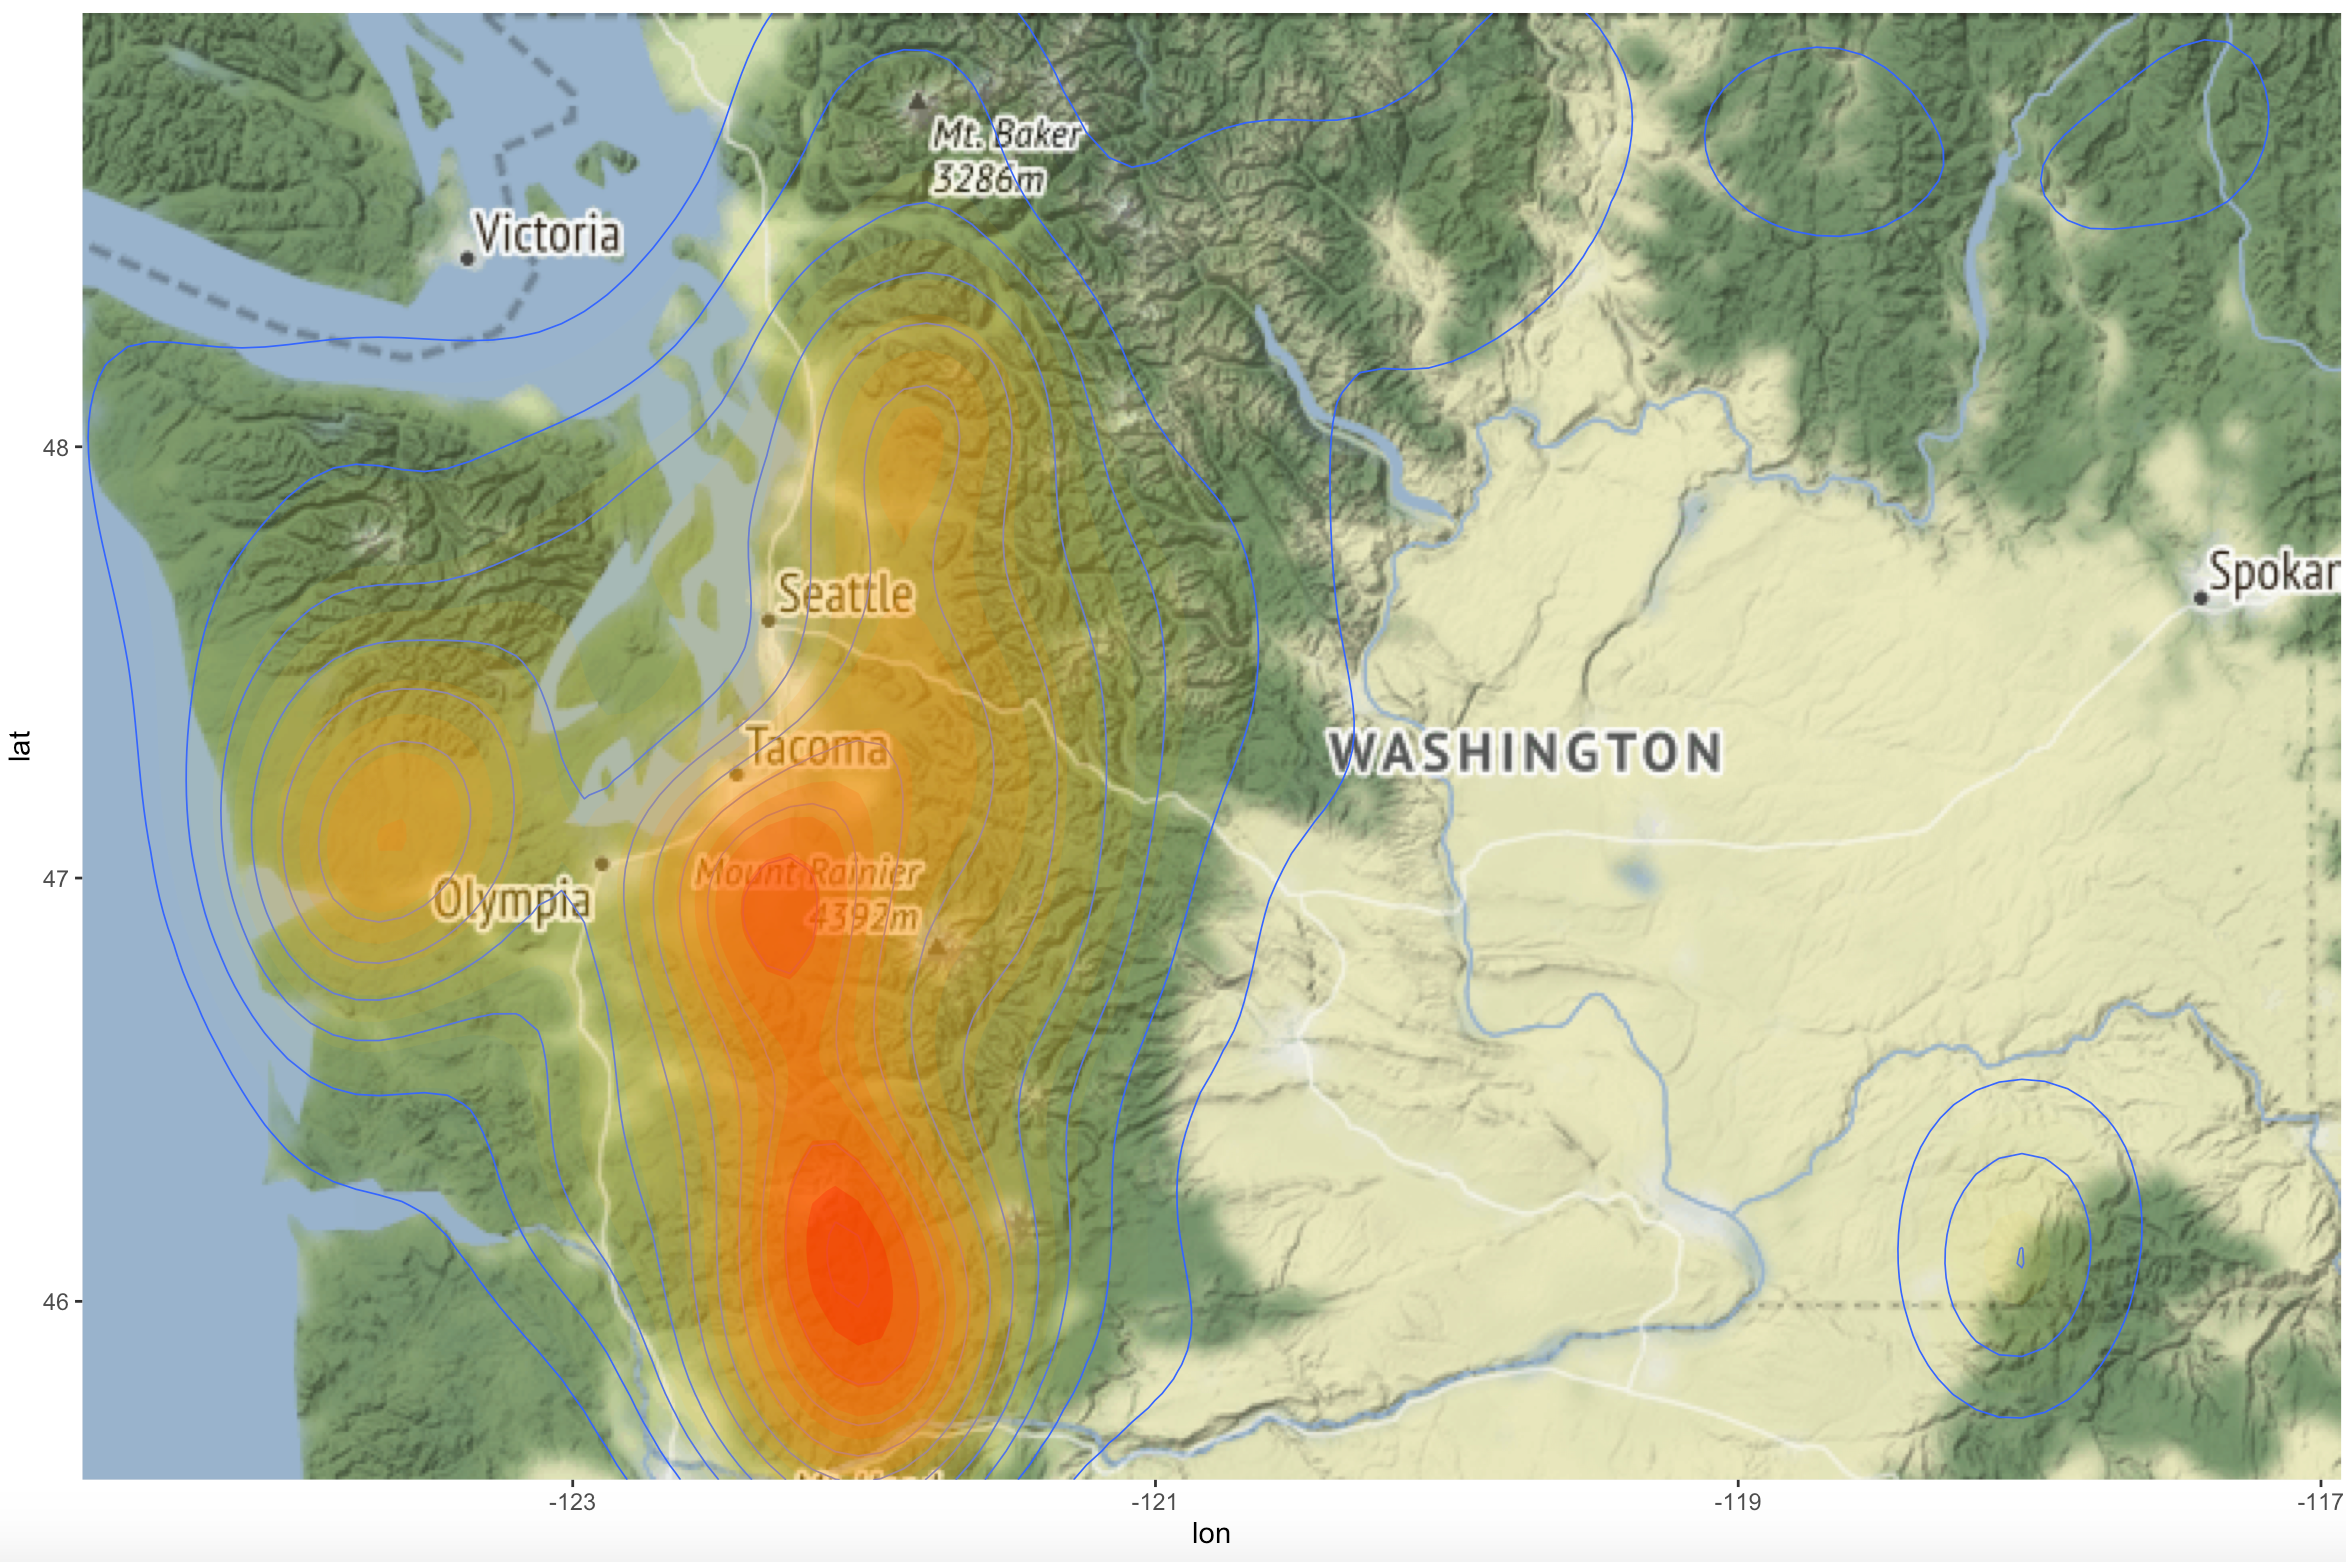
3D Mapping of Sasquatch Sightings in R with Rayshader
Prior articles in this series Introduction to GIS Analysis using Sasquatch SightingsSpatial Squatch – Using the ArcGIS Pro Spatial Statistics Toolbox to Identify Sighting PatternsMapping Clusters of Sasquatch SightingsSasquatch Sighting Heat Maps with R In this...