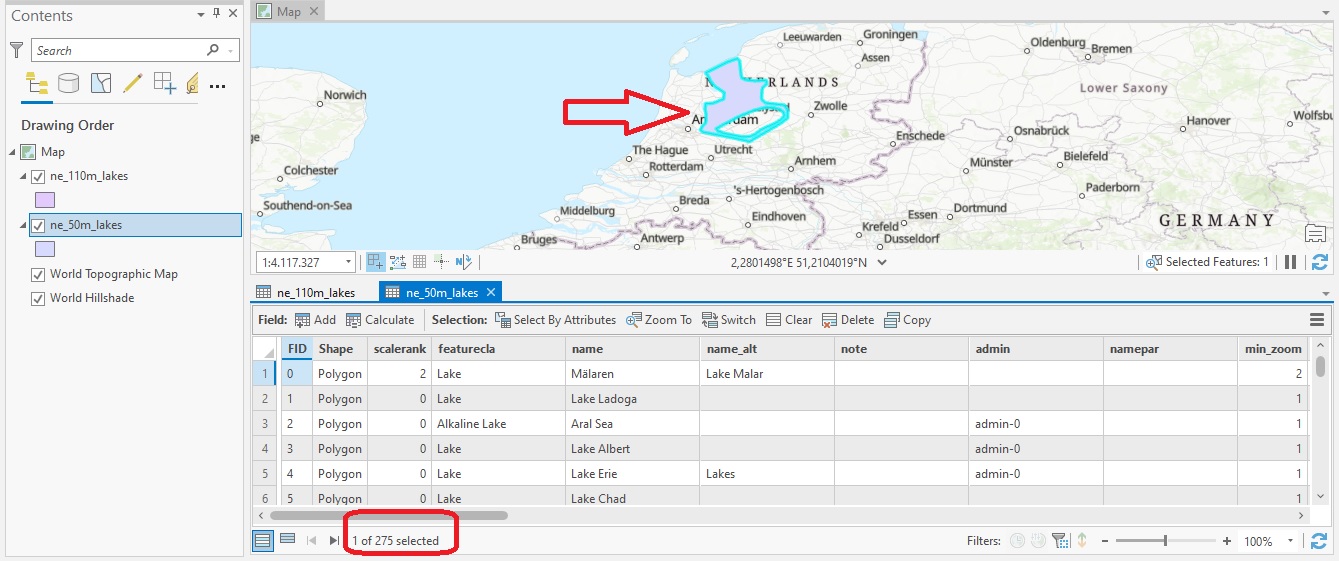
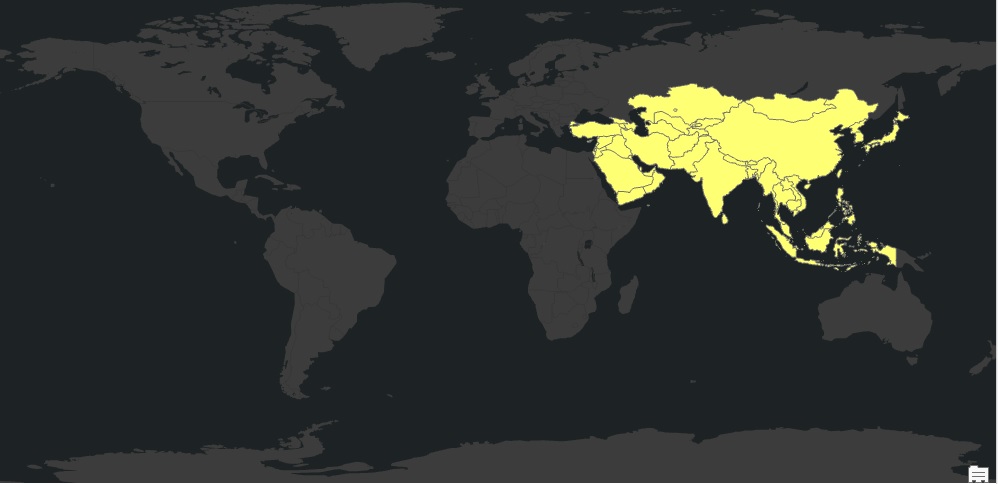
In this tutorial, you’ll learn how to append new data to existing data in Pro using the Append tool. The Append Tool in ArcGIS Pro is used to add new features or other data from multiple datasets into an existing dataset. It adds new data to an existing dataset of the...
Articles & Tutorials
Tutorial: Creating a COVID-19 Map of NYC in ArcGIS Pro
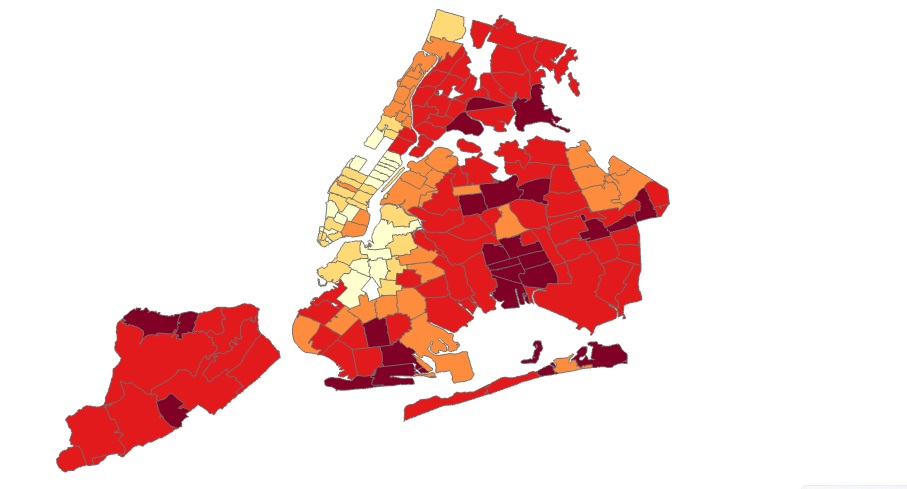
In this tutorial, you’ll be recreating a COVID map of NYC that shows percentages of COVID cases for different parts of the city over the last seven days. Introduction The following link shows an interactive web map of COVID-19 cases in NYC (also displayed on the image...
Tutorial: Converting Shapefiles to JSON with ArcGIS Pro
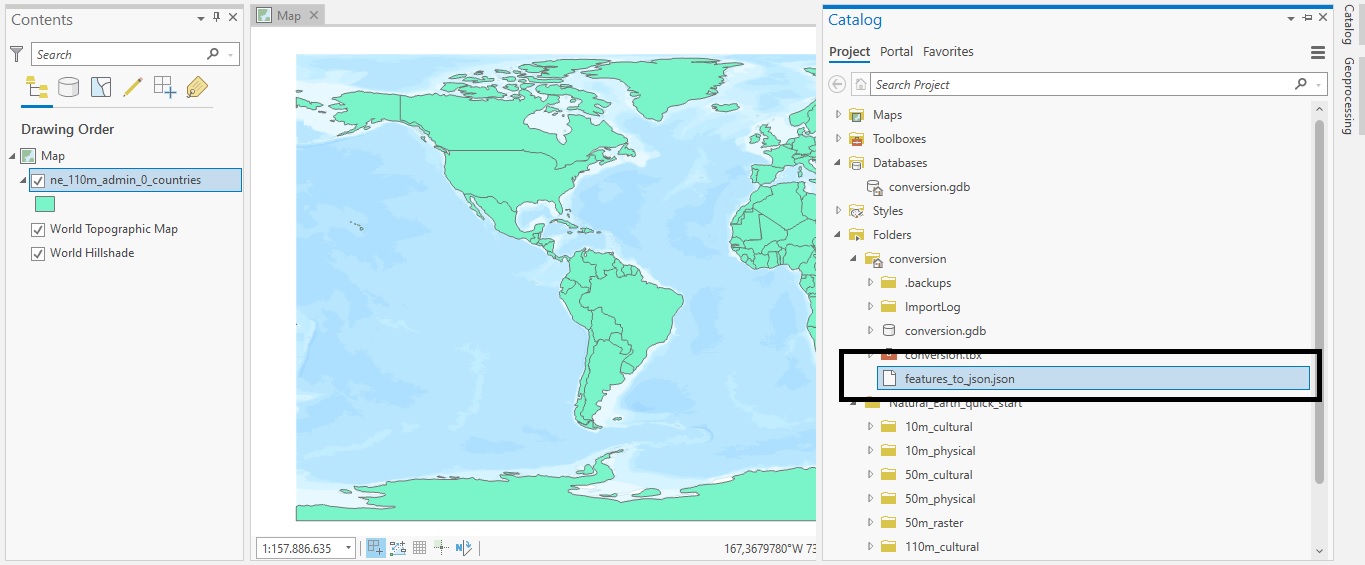
In this tutorial, we’ll cover how you can do data conversion with ArcGIS Pro’s Conversion toolset. Data conversion means that you will change data from one file format to another. This is often required when importing or exporting data out of Pro and use it in another...
Tutorial: Introducing the Field Statistics to Table tool in ArcGIS Pro 2.9
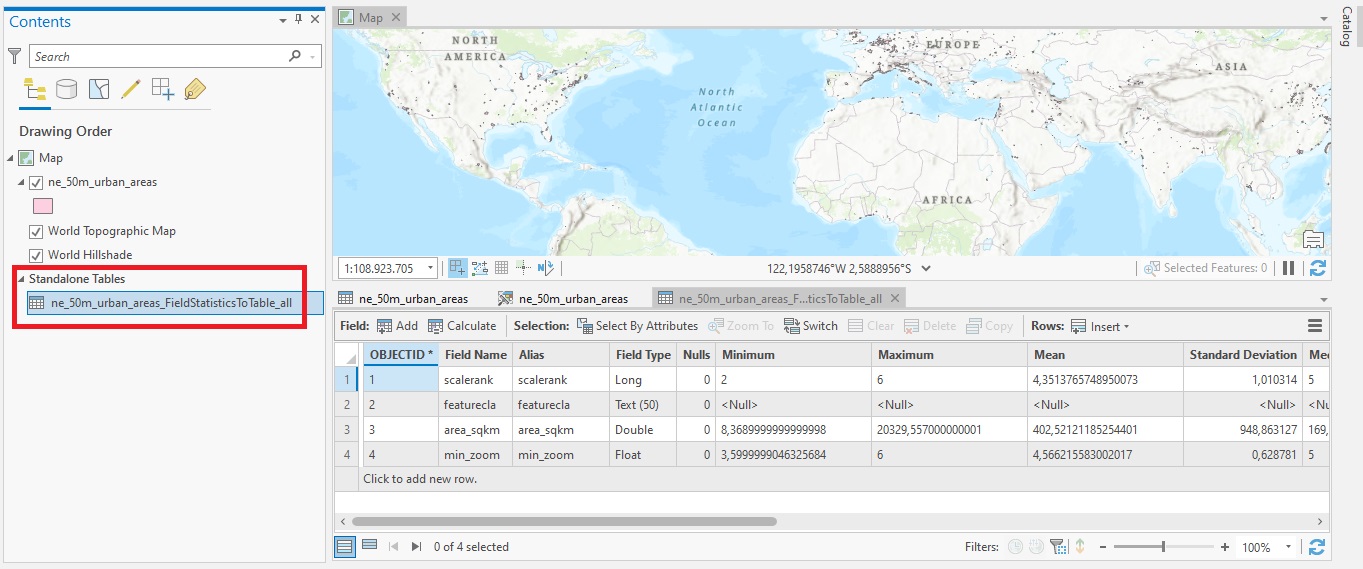
In this tutorial, we’ll cover the Field Statistics to Table tool, that gives more flexibility to calculating field statistics from attribute table data. As the name suggests, the Field Statistics to Table tool creates a standalone table of descriptive statistics for...
Tutorial: Creating A Spatially Enabled DataFrame in ArcGIS Pro
In this tutorial, we’ll show how you can use a Spatially Enabled DataFrame (SDEF) in ArcGIS Pro to easily convert feature classes back and forth to pandas dataframes. Esri’s ArcGIS API for Python introduced the Spatially Enabled DataFrame, an object to manipulate...
Dynamic Feature Clustering in ArcGIS Pro 2.9
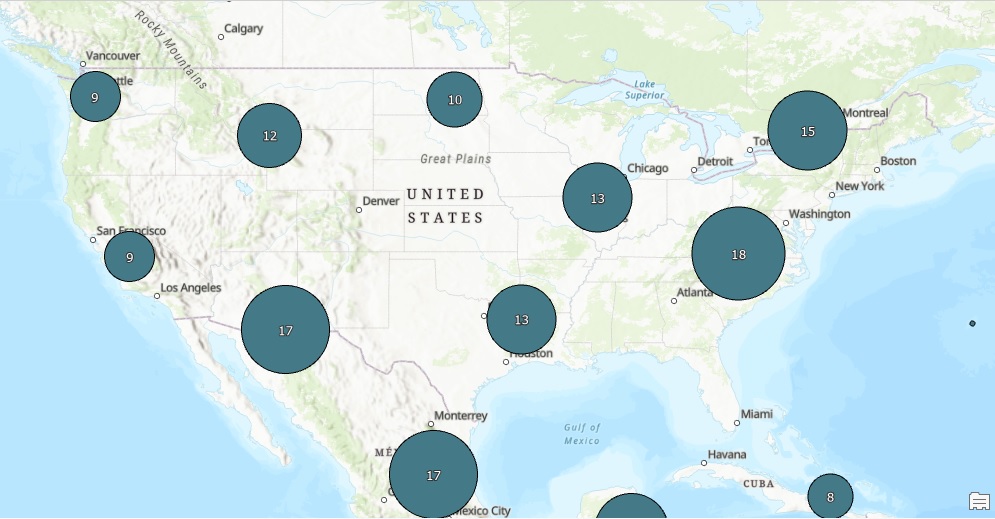
The latest release of ArcGIS Pro includes a new way to aggregate features into clusters. This tutorial explains how to use this capability. What is feature clustering? Feature clustering is a way to aggregate point features into clusters, which are symbols that...
Setting A Map Projection for Single and Multiple Layers in ArcGIS Pro
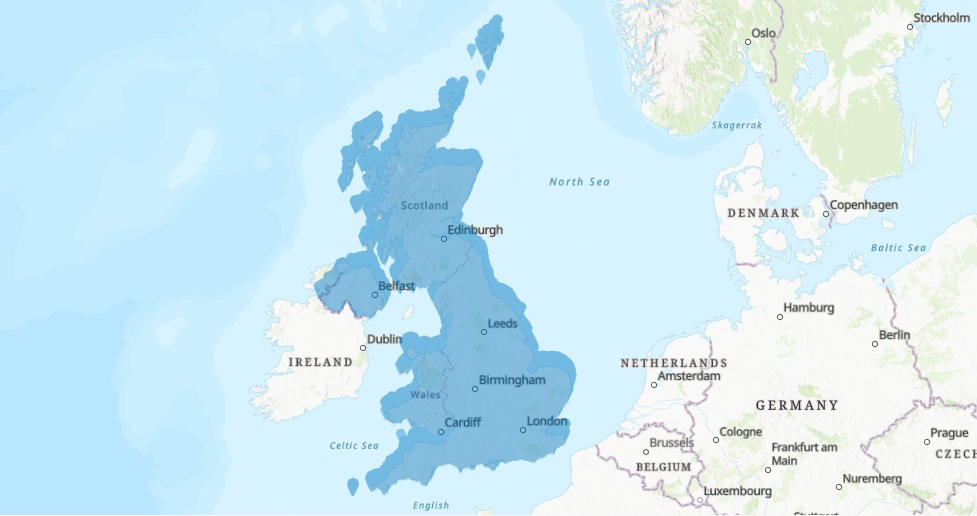
In this tutorial, we’ll add an XY-value dataset to ArcGIS Pro and show how to project a single map layer and set the projection for multiple layers inside a map. Introduction Often, you will need to work with spatial data from outside your organization. You will have...
Tutorial: Configure and Display Pop-ups in ArcGIS Pro
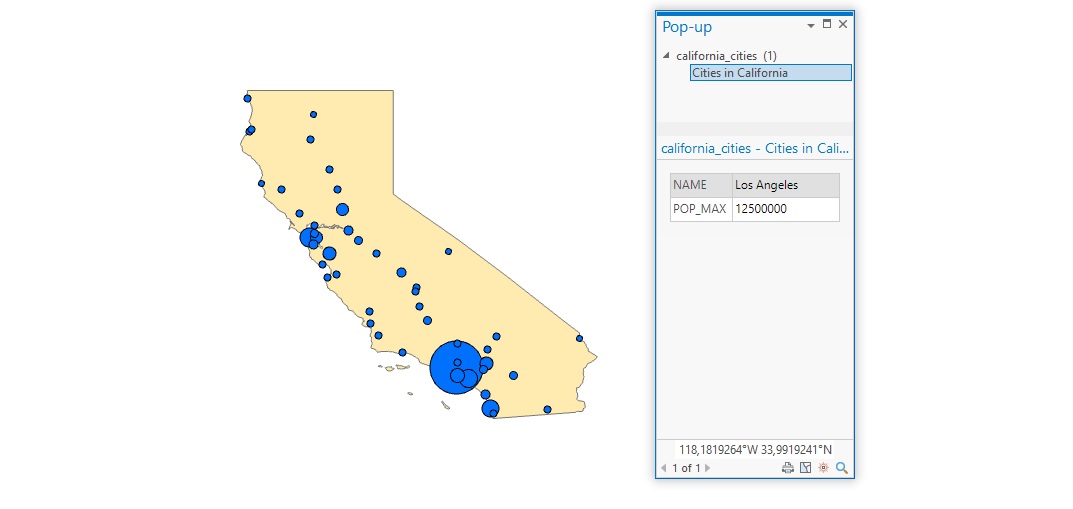
In this tutorial, we’ll learn how to configure and display simple pop-ups for feature layers. In Pro, pop-ups can be configured to display information about individual map features. Rather than statically displaying this information on a map, the user can click on a...
Tutorial: Visualize and Reuse GIS Workflows with Model Builder in ArcGIS Pro
In this tutorial, we’ll use Pro’s Model Builder to create a reusable workflow. Pro’s Model Builder is a visual workflow tool lets you automate GIS workflows. You can use it to chain the input and output of multiple geoprocessing tools, and save that for future use. In...
Tutorial – Creating a Heat Map in ArcGIS Pro
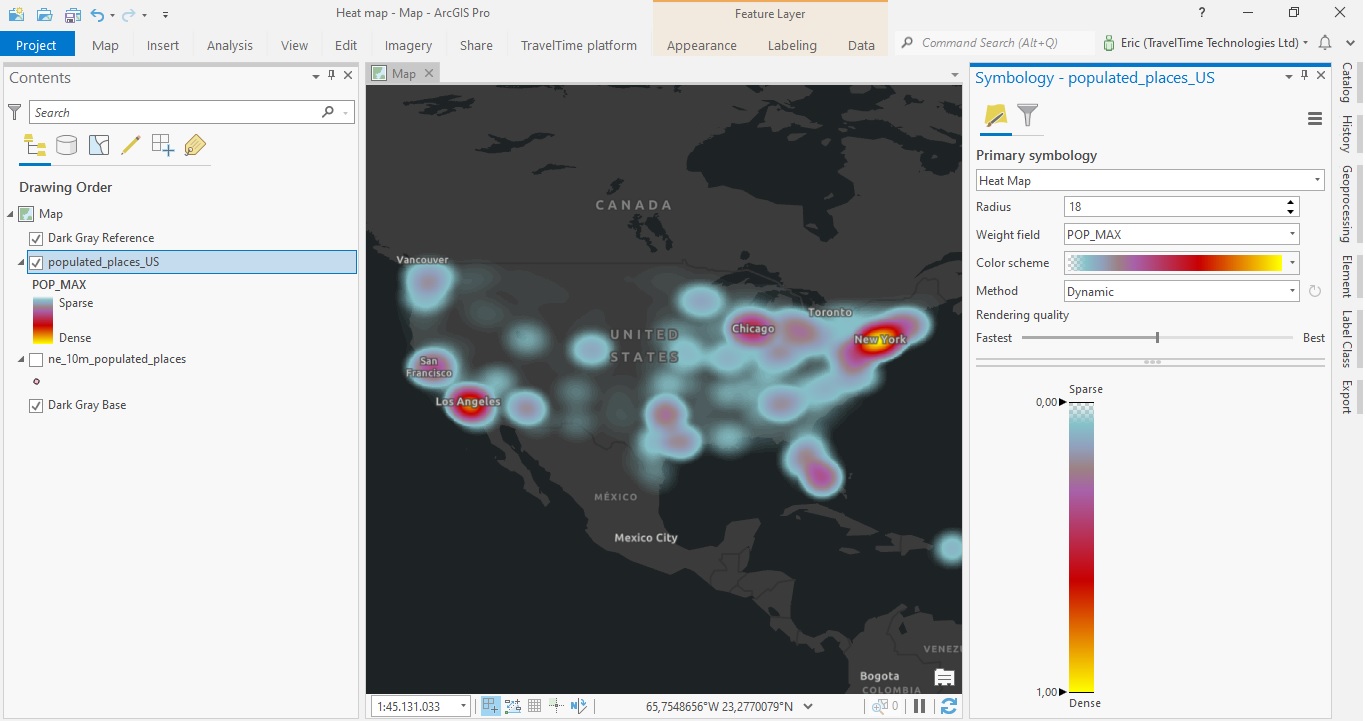
In this tutorial, you will learn how to create a heat map in ArcGIS Pro. This heat map will display the distribution of individual points that represent populated areas in the US. Using population values as a weight field, we can visualize the highest populated areas...

