

In this tutorial, you’ll be recreating a COVID map of NYC that shows percentages of COVID cases for different parts of the city over the last seven days.
Introduction
The following link shows an interactive web map of COVID-19 cases in NYC (also displayed on the image below, on the left). The data on the map show percent positivity and test rate over the last seven days of data, or hospitalization and death rates over the last 28 days of available data. It is possible to recreate his map inside ArcGIS Pro as the data is available for download from the same website. More specifically, we’ll be doing the following in this tutorial:
- Download the required data (this includes map geometry data and COVID-19 cases as a CSV file),
- Display the COVID-19 cases on the map as point data, and display the polygon data of different areas of NYC,
- Apply a spatial join to link the COVID-19 (point) data to the NYC polygons,
- Apply map symbology using the COVID-19 percentages of the last seven days.
The result will look as the right map on the image below:

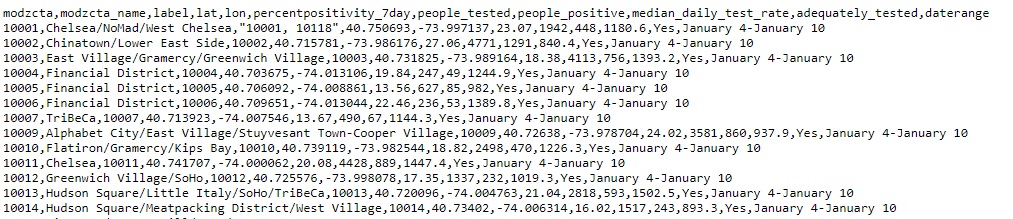
STEP 1: Download and prepare the data First, open a new, empty project inside Pro using a map template. We’ll first download the shapefile with the NYC area polygons. These are available as a shapefile here. Download the shapefile, unzip the file and add a folder connection in Catalog. Drag the shapefile to the map window and rename it inside the Content pane. Now we need to download the data with COVID-19 cases. These are available as a CVS file, containing both X and Y columns, which enables us to man map these data as XY coordinates on the map, shown as a point features layer. The data can be downloaded here and should be copied and pasted from the browser to a new, empty csv file (save as .CSV inside a text editor such as Notepad). A snippet of the data is listed below. Note the first column name (‘modzcta’ which stands for Modified Zip Code Tabulation Areas), that is also present in the polygon layer and will serve as our common field on which to perform the spatial join next.
STEP 2: Display the polygon and point data on a map
Next, add the newly created CSV file to the map window using the Catalog pane and select “Map” from the ribbon interface, then “Add Data”, next “Add XY point data” and choose the CSV as the input table. The X and Y fields should be added and correct. For the coordinate system parameter, change “WGS1984” to “WGS1984(DD)”, which is the one from the shapefile. These need to be identical in order to be able to perform the spatial join below. Click “Run”. You should see the following point and polygon data added to the map:

STEP 3: Apply a spatial join
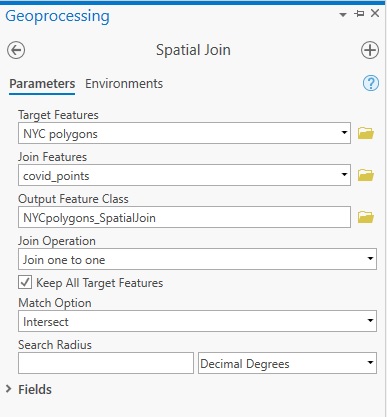
Because the points and polygons have a spatial relationship (each point lies inside a single polygon), we can perform a spatial join so that the information from the CSV file with the latest COVID-19 data is joined with the polygon data. Search for the Spatial Join tool in the geoprocessing tools and double click it. We can now perform the spatial join. Use the following parameters to run the tool:
STEP 4: Apply map symbology A new polygon layer with the joined field data has been added to the map. We’ll now map the field values of the “percentpositive7day” field for each polygon. We apply symbology to the map to recreate the map displayed above in the introduction. To do this, make sure the new polygon is selected and visible in the Contents pane. Next, click “Appearance” and “Symbology” in the ribbon interface and select Graduated Colors. Use the following parameters for the correct field, map colors and classes:
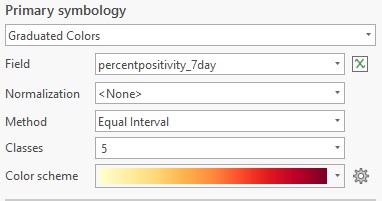
Using a Yellow-Orange-Red continuous color scheme will give you darker colors for higher percentages instead of using a single color for each class. You should now see the map that has been displayed in the Introduction.
