

In this tutorial, we’ll use Pro’s Model Builder to create a reusable workflow.
Pro’s Model Builder is a visual workflow tool lets you automate GIS workflows. You can use it to chain the input and output of multiple geoprocessing tools, and save that for future use. In this tutorial, we’ll use multiple geoprocessing tools and link them using a workflow visualization in Model Builder.
Specifically, we’ll be using be doing the following:
- Create a new Model using Model Builder that can be saved and reused
- Run the tool and have a look at the results
The GIS workflow we’ll automate using Model Builder is a little trivial and simple, but serves as a demonstration of how to create a model using Model Builder. The workflows is as follows:
- Run the select tool using a query on a shapefile with point data to select populated places in the US
- Use that selection as an input for another geoprocessing tool, in this case Get Count to count all point features from this selection.
STEP 1: Download the data and create a new project in Pro
This tutorial uses the Natural Earth Quick Start kit, that can be downloaded here. To follow along with this tutorial, download the data on your hard drive, open Pro with a new, empty project and add a folder connection through the Catalog interface to the Natural Earth Dataset. Next, drag the ne_10m_populated_places.shp from the 10m_cultural folder to the map.
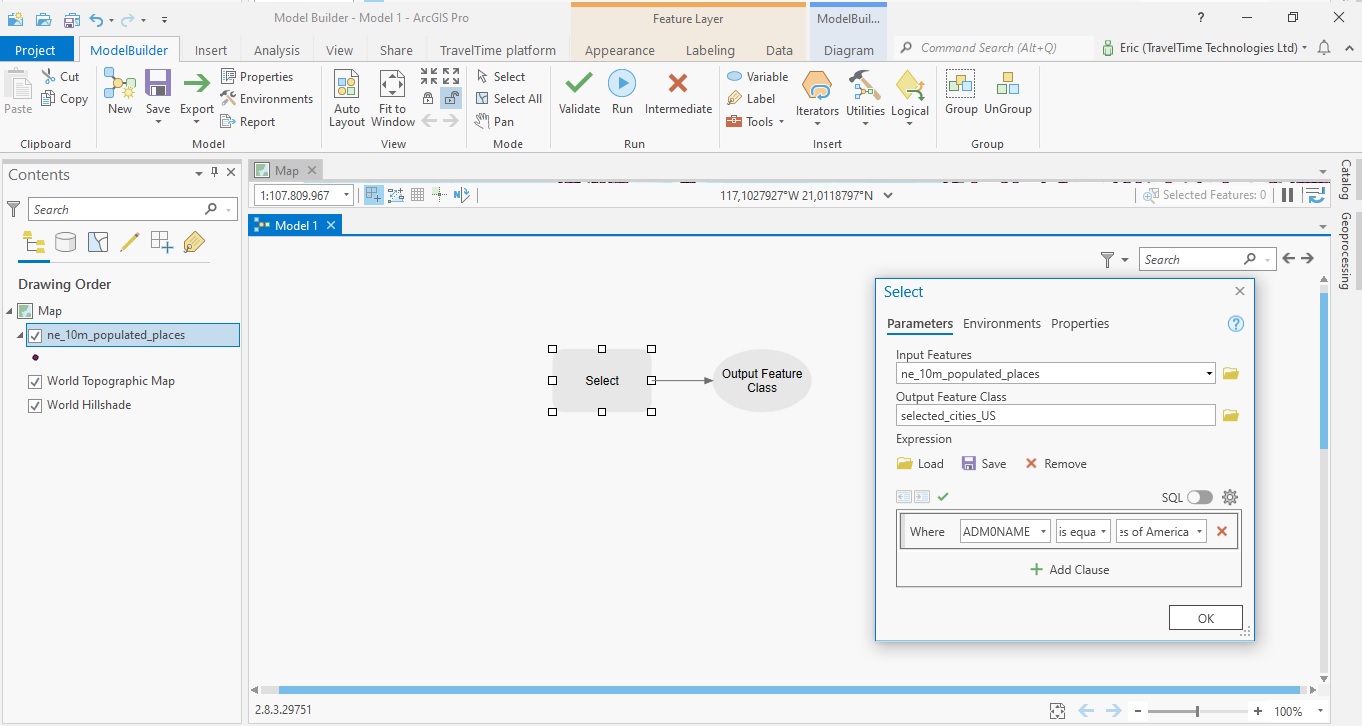
STEP 2: Add the Select tool to the Model Builder We’ll now create a model from scratch. Open Model Builder inside Pro. This is done by clicking Analysis on the ribbon interface, and then selecting the Model Builder icon. Next, search for the Select tool by clicking “Analysis” and then “Tools” on the ribbon interface and search for the tool. Once found, drag the tool icon to the Model Builder window. The tool is displayed as a rectangle with an arrow attached to it to the right with an output icon. Right-click the tool and select “Open”. Use the Where clause tool parameters displayed below and click “OK”. The grey box will turn yellow and the output box will turn green. You will also see a blue oval-shaped icon on the left showing the input variable.
STEP 3: Add the Get Count tool to Model Builder
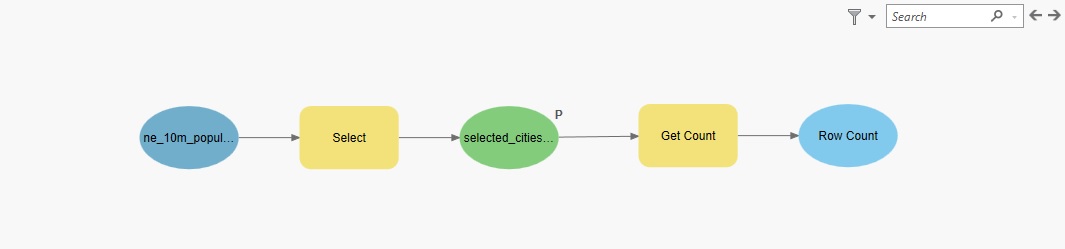
To be able to count the rows of the output of the Select Tool, you will first have to assign the green box named “selected_cities_US” a Parameter value in the Model Builder. This is done by clicking the green box and select “Parameter”. The tool output is now marked with a “P”. If you don’t do this, you cannot add the Get Count feature to the Model Builder. Next, search for the Get Count geoprocessing tool and connect the green box to the Get Count tool with an arrow, by clicking it once and clicking the Get Count rectangle a second time when you see a connecting line between the two icons. You should see the following image:
You can now run the model. Click “Run” after right-clicking the model and selecting “Run”, or through the Model Builder menu on the ribbon interface using the “Run” button there. The model produces the output displayed below. Do not close the model after running it, we’ll need to save it first, which we’ll do after interpreting the results.
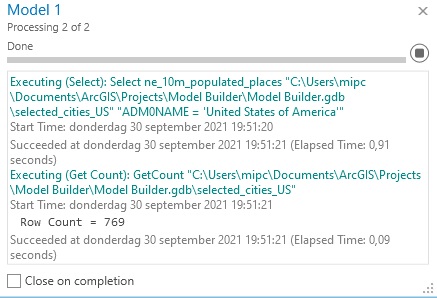
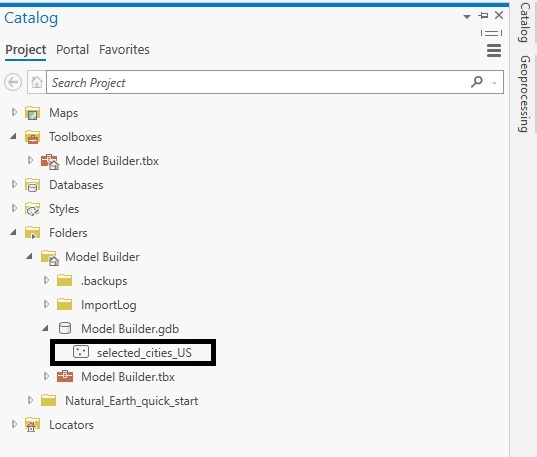
The image above shows that both geoprocessing tools ran well. The first geoprocessing tool produced a new shapefile, and the second one a row count of 769. To visualize the new shapefile, open the Catalog pane, click the .gdb file of the current project and click “refresh” (right mouse click). The newly produced shapefile “selected_cities_US” should pop up now:
STEP 4: Save the model Add the shapefile to the map if you want to see what it looks like. All you need to do now is save the model if you want to reuse it later. To save the model, click “Model Builder” on the ribbon interface and next “Save As”. Save the Model under a useful name, such as “Select and count US cities”. Close the Model window by clicking the X in the top-right window and save once more before exiting. Next, click “Analysis” and “Tools” in the ribbon interface and search for “Select and Count US cities”. The Model will show up as the first search result. To visualize the model, right-click the tool and choose “edit”.
