In this tutorial, we’ll add an XY-value dataset to ArcGIS Pro and show how to project a single map layer and set the projection for multiple layers inside a map.
Introduction
Often, you will need to work with spatial data from outside your organization. You will have to figure out what it represents and how to import it correctly in order to be able to work with it inside Pro. Here, we’ll be using a dataset that has latitude and longitude values that has already been projected. We’ll perform the following four steps:
- Download and examine the data
- Add the data to the map window in Pro
- Change the projection of a single layer
- Change the projection for the entire map, including all data layers
STEP 1: Download and examine the (meta)data
Open ArcGIS Pro and create a new, empty project. We’ll now need to download the spatial dataset for this tutorial. We’ll be using the UK 2011 census Postcode Headcounts and Households dataset, a very large .csv file that contains all UK postal codes and the total persons recorded in that postcode, among others. Download the table to your hard drive, add a folder connection inside ArcGIS Pro through the Catalog window to access the dataset. Next, drag the postcodes_data.csv file to the map window, so that it is listed in the Contents pane, but not on the map. We will do this in Step 2.
Before drawing the postal codes to the map, it is recommendable to look up the metadata file that tells you what the different columns in your dataset represent. To do this, open the postcodes_meta.csv file that comes with the data download and notice that columns 8 and 9 contain x and y coordinates in WGS84 geographic projection:
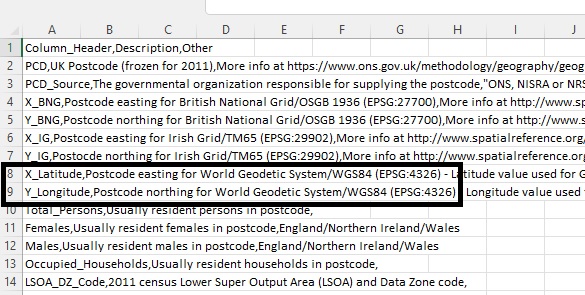
A simple Google search for “lat lon values” will tell you that latitude and longitude are a pair of numbers (coordinates) used to describe a position on the plane of a geographic coordinate system. These numbers are in decimal degrees format and range from -90 to 90 for latitude and -180 to 180 for longitude. Luckily, the data has been projected so that Pro won’t have trouble displaying it on a map. We also know that the data belong to the UK, so when displayed inside Pro, it should line up with the UK basemap.
STEP 2: Add the data to the map window in Pro
Using columns 8 and 9 from the .csv file, you can draw the postal codes on the map inside ArcGIS Pro. This is done by choosing “Map” on the ribbon interface, selecting “Add Data” and “XY Point Data” from the dropdown list. Next, the “XY Table to Point” tool window will open, where you will need to specify the input table name and the column names for the x and y coordinate values. Use the parameters specified in the image below to make sure you get the X and Y values correctly:
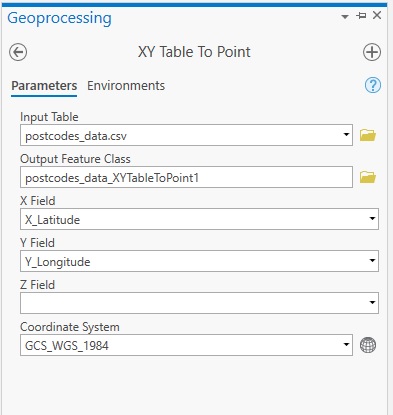
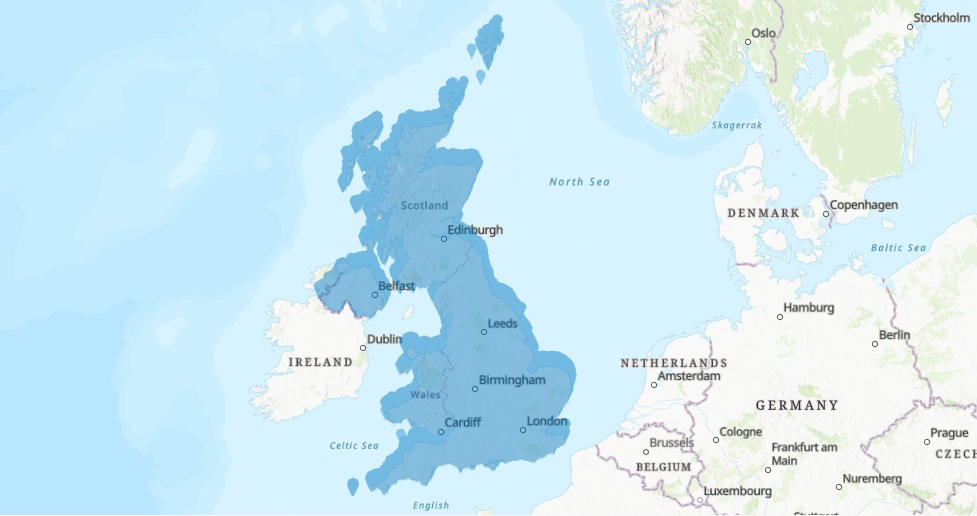
Make sure that the coordinate system is set to “GCS_WGS_1984” for the new feature layer showing the postal codes. This way, Pro can correctly link the correct coordinate system to the values in the two columns (8 and 9 respectively) specified in the .csv file. Click “Run”. (Notice that Pro’s basemap uses Web Mercator as the default projection, which is slightly different from the WGS1984 projection of our .csv file, and explains the different projection on the image below.) There are many records in the table so it will take some time for the tool to finish and draw all point features on the map. Check if the results line up with the underlying map layers as in the map image below, that shows all postcode areas for the entire UK in blue:

STEP 3: Change the projection of a single layer
Our newly created data layer is projected in WGS1984, which is a geodetic coordinate system for the entire world. But as we are only displaying only UK data, it would make more sense to use a coordinate system for our specific region only, which is British National Grid (EPSG: 27700). We’ll use the Project tool to reproject our data layer. If you looked carefully at the metadata file from Figure 1, you could have used columns 4 and 5 directly in Step 1 and setting the coordinate system to “British National Grid” in the XY Table to Point tool to save you Step 3 from this tutorial, and projecting the entire map including the new data layer directly in this coordinate system, but knowing how to reproject individual data layers and the map object in Pro is very useful.
First, search for the Project tool under Data Management tools, and double-click it. Next, select the input feature class, leave the description of the output feature class as it is, and click the globe icon that says “Select coordinate system”:
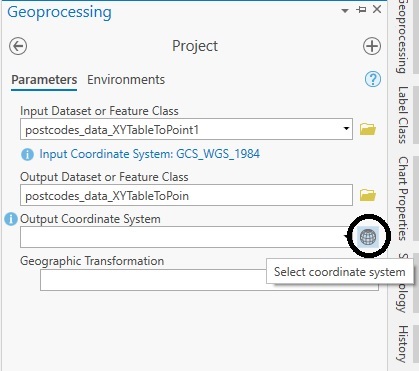
A new menu window will appear. Type “British” into the search bar and click “enter” to let Pro perform a selection for you based on this search term. Click the arrow left to “Projected Coordinate System” to display the menu and do it again for “National Grids”, then “Europe” and notice the option for “British National Grid”:
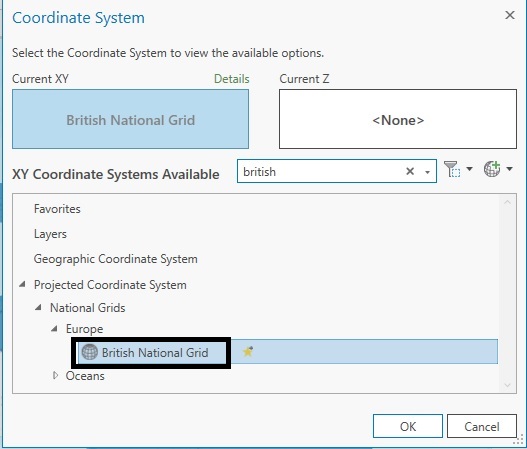
Click “OK” and notice that the empty form field under “Geographic Transformation” in the image above now contains the following text: “WGS_1984_To_OSGB_1936_OSTN15”. Click “Run” and notice that the data layer and basemaps are still draw in WGS1984. This is because we’ve reprojected only a single layer, instead of the map object from the Contents pane that contains all individual layers. This means that each feature class can have its own projection, but Pro cannot display more than one projection for a map. We’ll now look at how to change the projection for an entire map that contains multiple feature classes (layers).
STEP 4: Change the projection for the entire map
To change the map projection from WGS1984 to British National Grid, select the Map object in the Table of Contents, right-click, select “Properties”, then “Coordinate Systems”. Type in “British” in the search bar next to “XY coordinate systems available” and click enter. Select “British National Grid” and click “OK”. The entire map will now be rendered in this coordinate system, lining up our UK data layer correctly: