

The latest release of ArcGIS Pro includes a new way to aggregate features into clusters. This tutorial explains how to use this capability.
What is feature clustering?
Feature clustering is a way to aggregate point features into clusters, which are symbols that represent two or more point features. Clustering, in other words, let you group many different point features into larger ones, showing you how point features are distributed spatially or simplify a complex layer of points that are near to each other. While it was already possible to perform clustering from point features within Pro (such as creating a heat map), the new feature clustering capability that comes with Pro 2.9 introduces some added capabilities that give you more control at how clustering is done when you zoom on or out, or the values that represent a cluster on a map. We’ll now give an example of how to use this new capability.
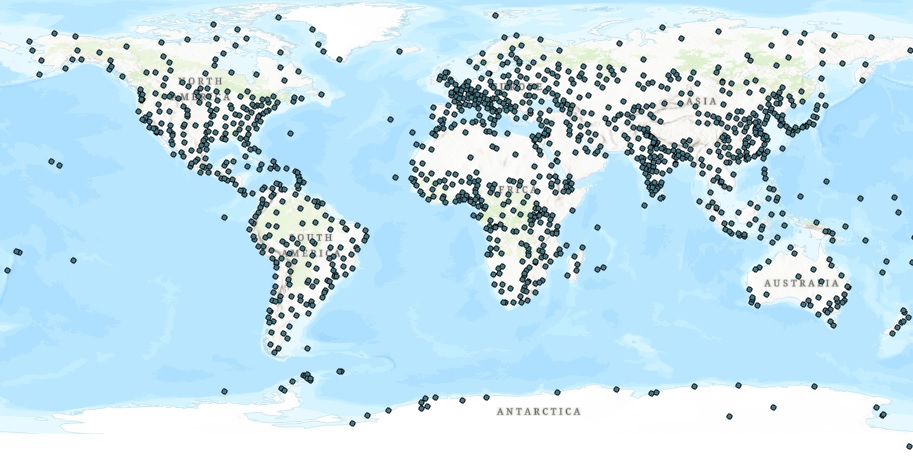
STEP 1: Download the data Download the Natural Earth quick start kit (227 mb), unzip the files on your hard drive and create a new, empty project in ArcGIS Pro. Create a folder connection to the downloaded dataset and drag the ne_50m_populated_places.shp file from the 50m_cultural folder to the map. You’ll see a new layer being added to the map with many point features:
STEP 2: Apply the aggregation tool to the point layer
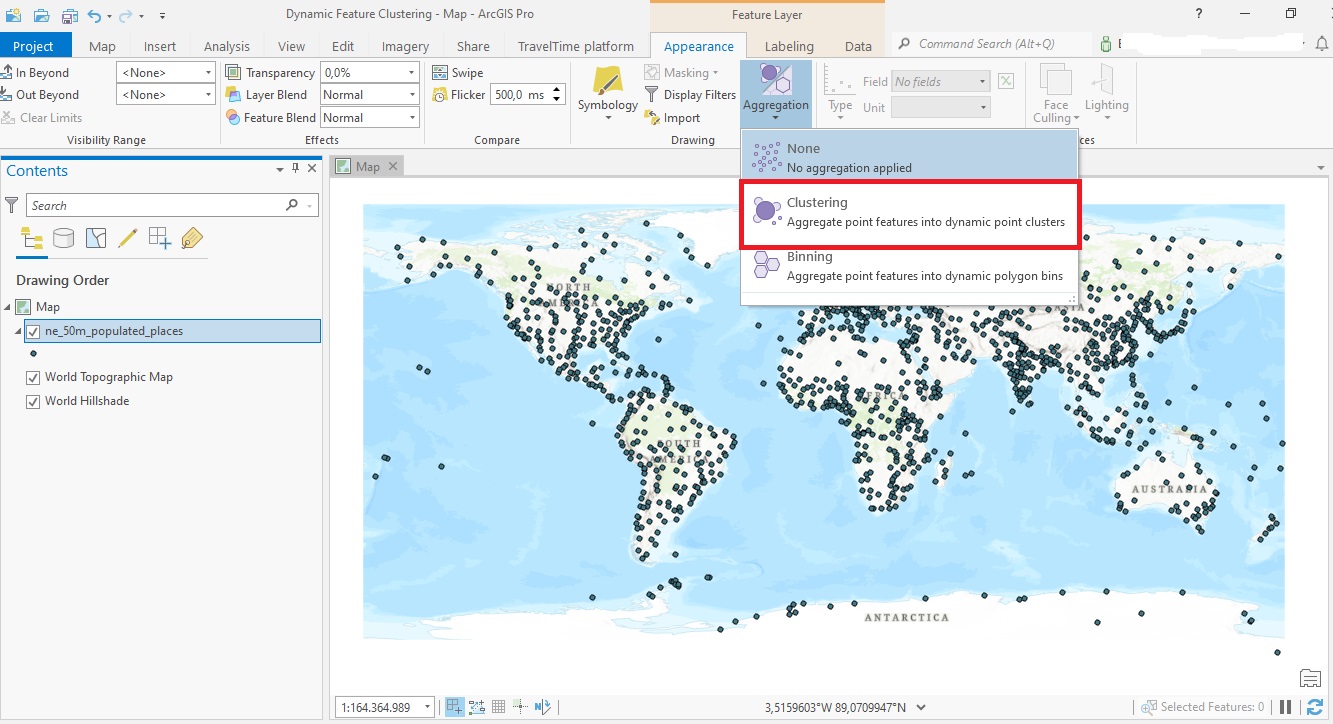
The point layer is quite cluttered and clustering would improve the map view. To apply clustering, select the point layer by clicking it in the Contents pane, click “Appearance” on the ribbon interface and select “Aggregation”. From the drop-down menu, choose “Clustering”:
The point features will now be clustered automatically. Zoom in and out of the map to see the clusters change size and the values they represent: this is dynamic feature clustering in action. The tool clusters point within a certain radius. As this radius changes when you zoom in and out, causing the cluster sizes to change with it. The values inside a cluster show a count of the total point features clustered within the point feature.
STEP 3: Change the clustering radius
Pro 2.9 lets you can change to clustering radius yourself. Check if you have the feature layer selected in the Contents tab, causing the ribbon to highlight the Feature Layer and the Aggregation tabs. Click the Clustering tab under Aggregation and select the Clustering Radius tool, that will show a slider bar:
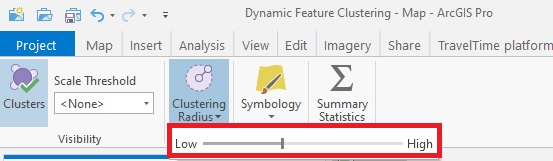
A high clustering radius (below, right) results in less clusters than a low clustering radius (below, left):

STEP 4: Design a summary field statistic to change the cluster values on the map
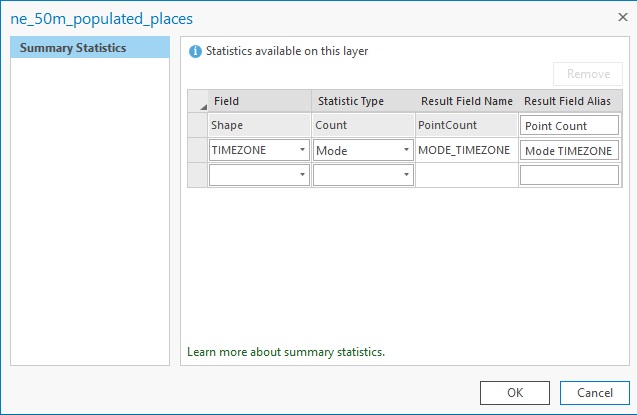
We’ll now design a summary statistic field to change the representation of our clusters. So far, the cluster values only represented the total feature count inside a cluster. The Summary Statistics tool lets you create your own summary statistic fields, so you have more control of which attribute field values you display. As an example, we’ll use the TIMEZONE field our of point feature layer.
To do this, click the Summary Statistics button in the Clusters menu on the ribbon interface. Setting the Count column to “Mode” will display the timezone value that is counted most for that particular cluster, so we’ll see how time zones change for different parts of the world . Set the tool parameter as follows and click “OK”.
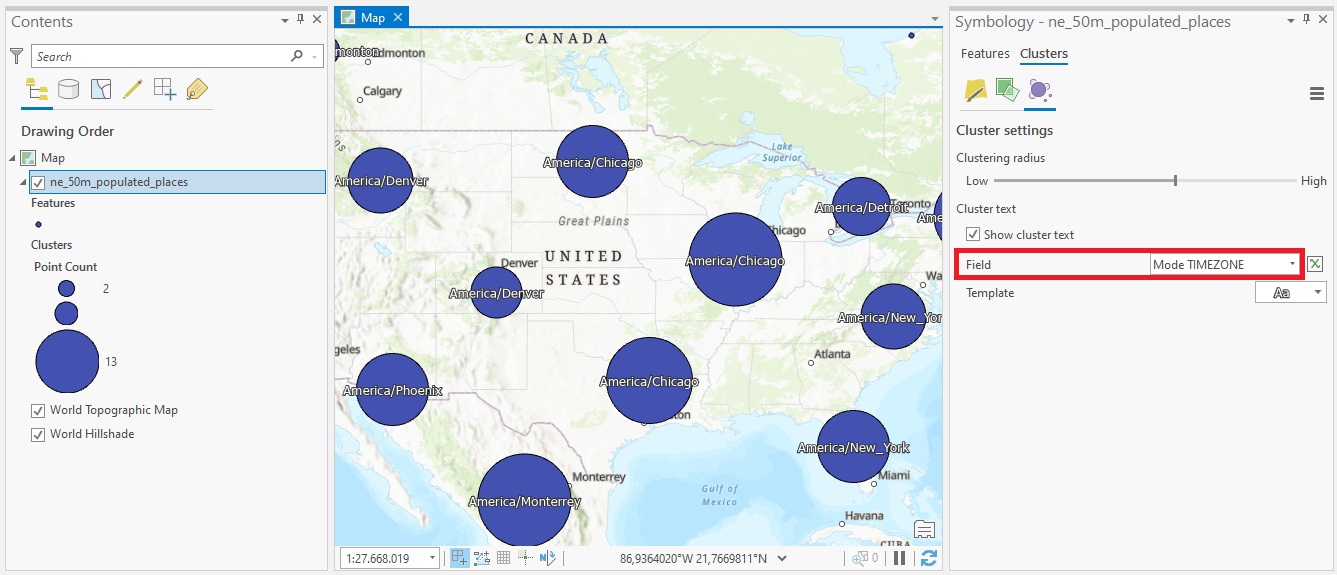
The clusters on the map won’t change. This is because you have to change the symbology for your feature class yourself. You can do this by clicking the Symbology image with a canvas and paintbrush inside the Clusters menu on the ribbon interface. Make sure not to click the dropdown button below it, but the image so it immediately opens up the Symbology pane displayed below. Use the settings below to set the field value to the summary statistics field we’ve just created and see how the values on the now display the most counted time zone value for that cluster:
Did you know you can save up to 20% on any of our GIS classes? Through the end of December you can enter the discount code ‘holiday’ when checking out online. Discount already applied to Annual GIS Training License.
Live-Online Classes
Self-Paced Classes
Live, In-Person Classes
Training Bundles
