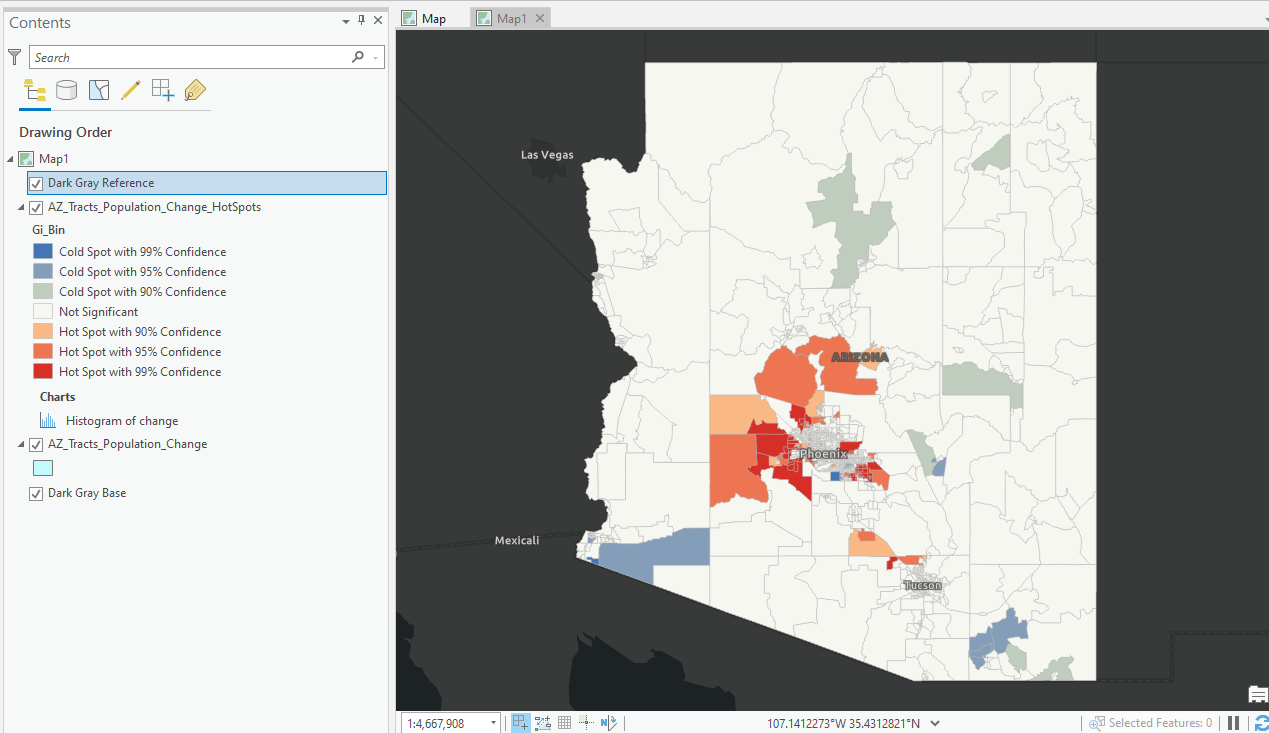
Mapping Population Growth Hot Spots with R and ArcGIS Pro
This tutorial demonstrates how to use R and ArcGIS Pro to generate hot spot maps of population growth by census tract. In a previous article I showed you how to use the tidycensus R package to quickly access and map US census data. You can also download a free copy of...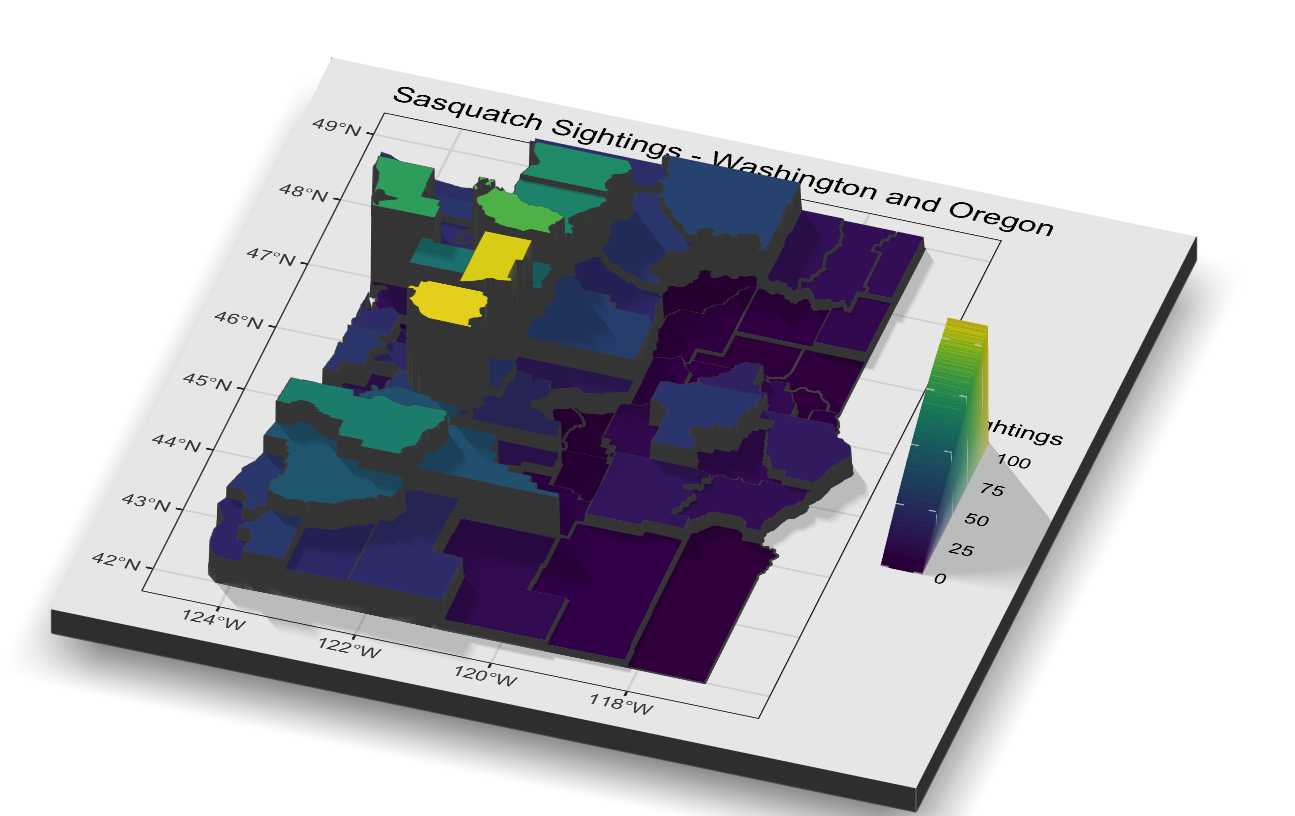
3D Mapping of Sasquatch Sightings in R with Rayshader
Prior articles in this series Introduction to GIS Analysis using Sasquatch SightingsSpatial Squatch – Using the ArcGIS Pro Spatial Statistics Toolbox to Identify Sighting PatternsMapping Clusters of Sasquatch SightingsSasquatch Sighting Heat Maps with R In this...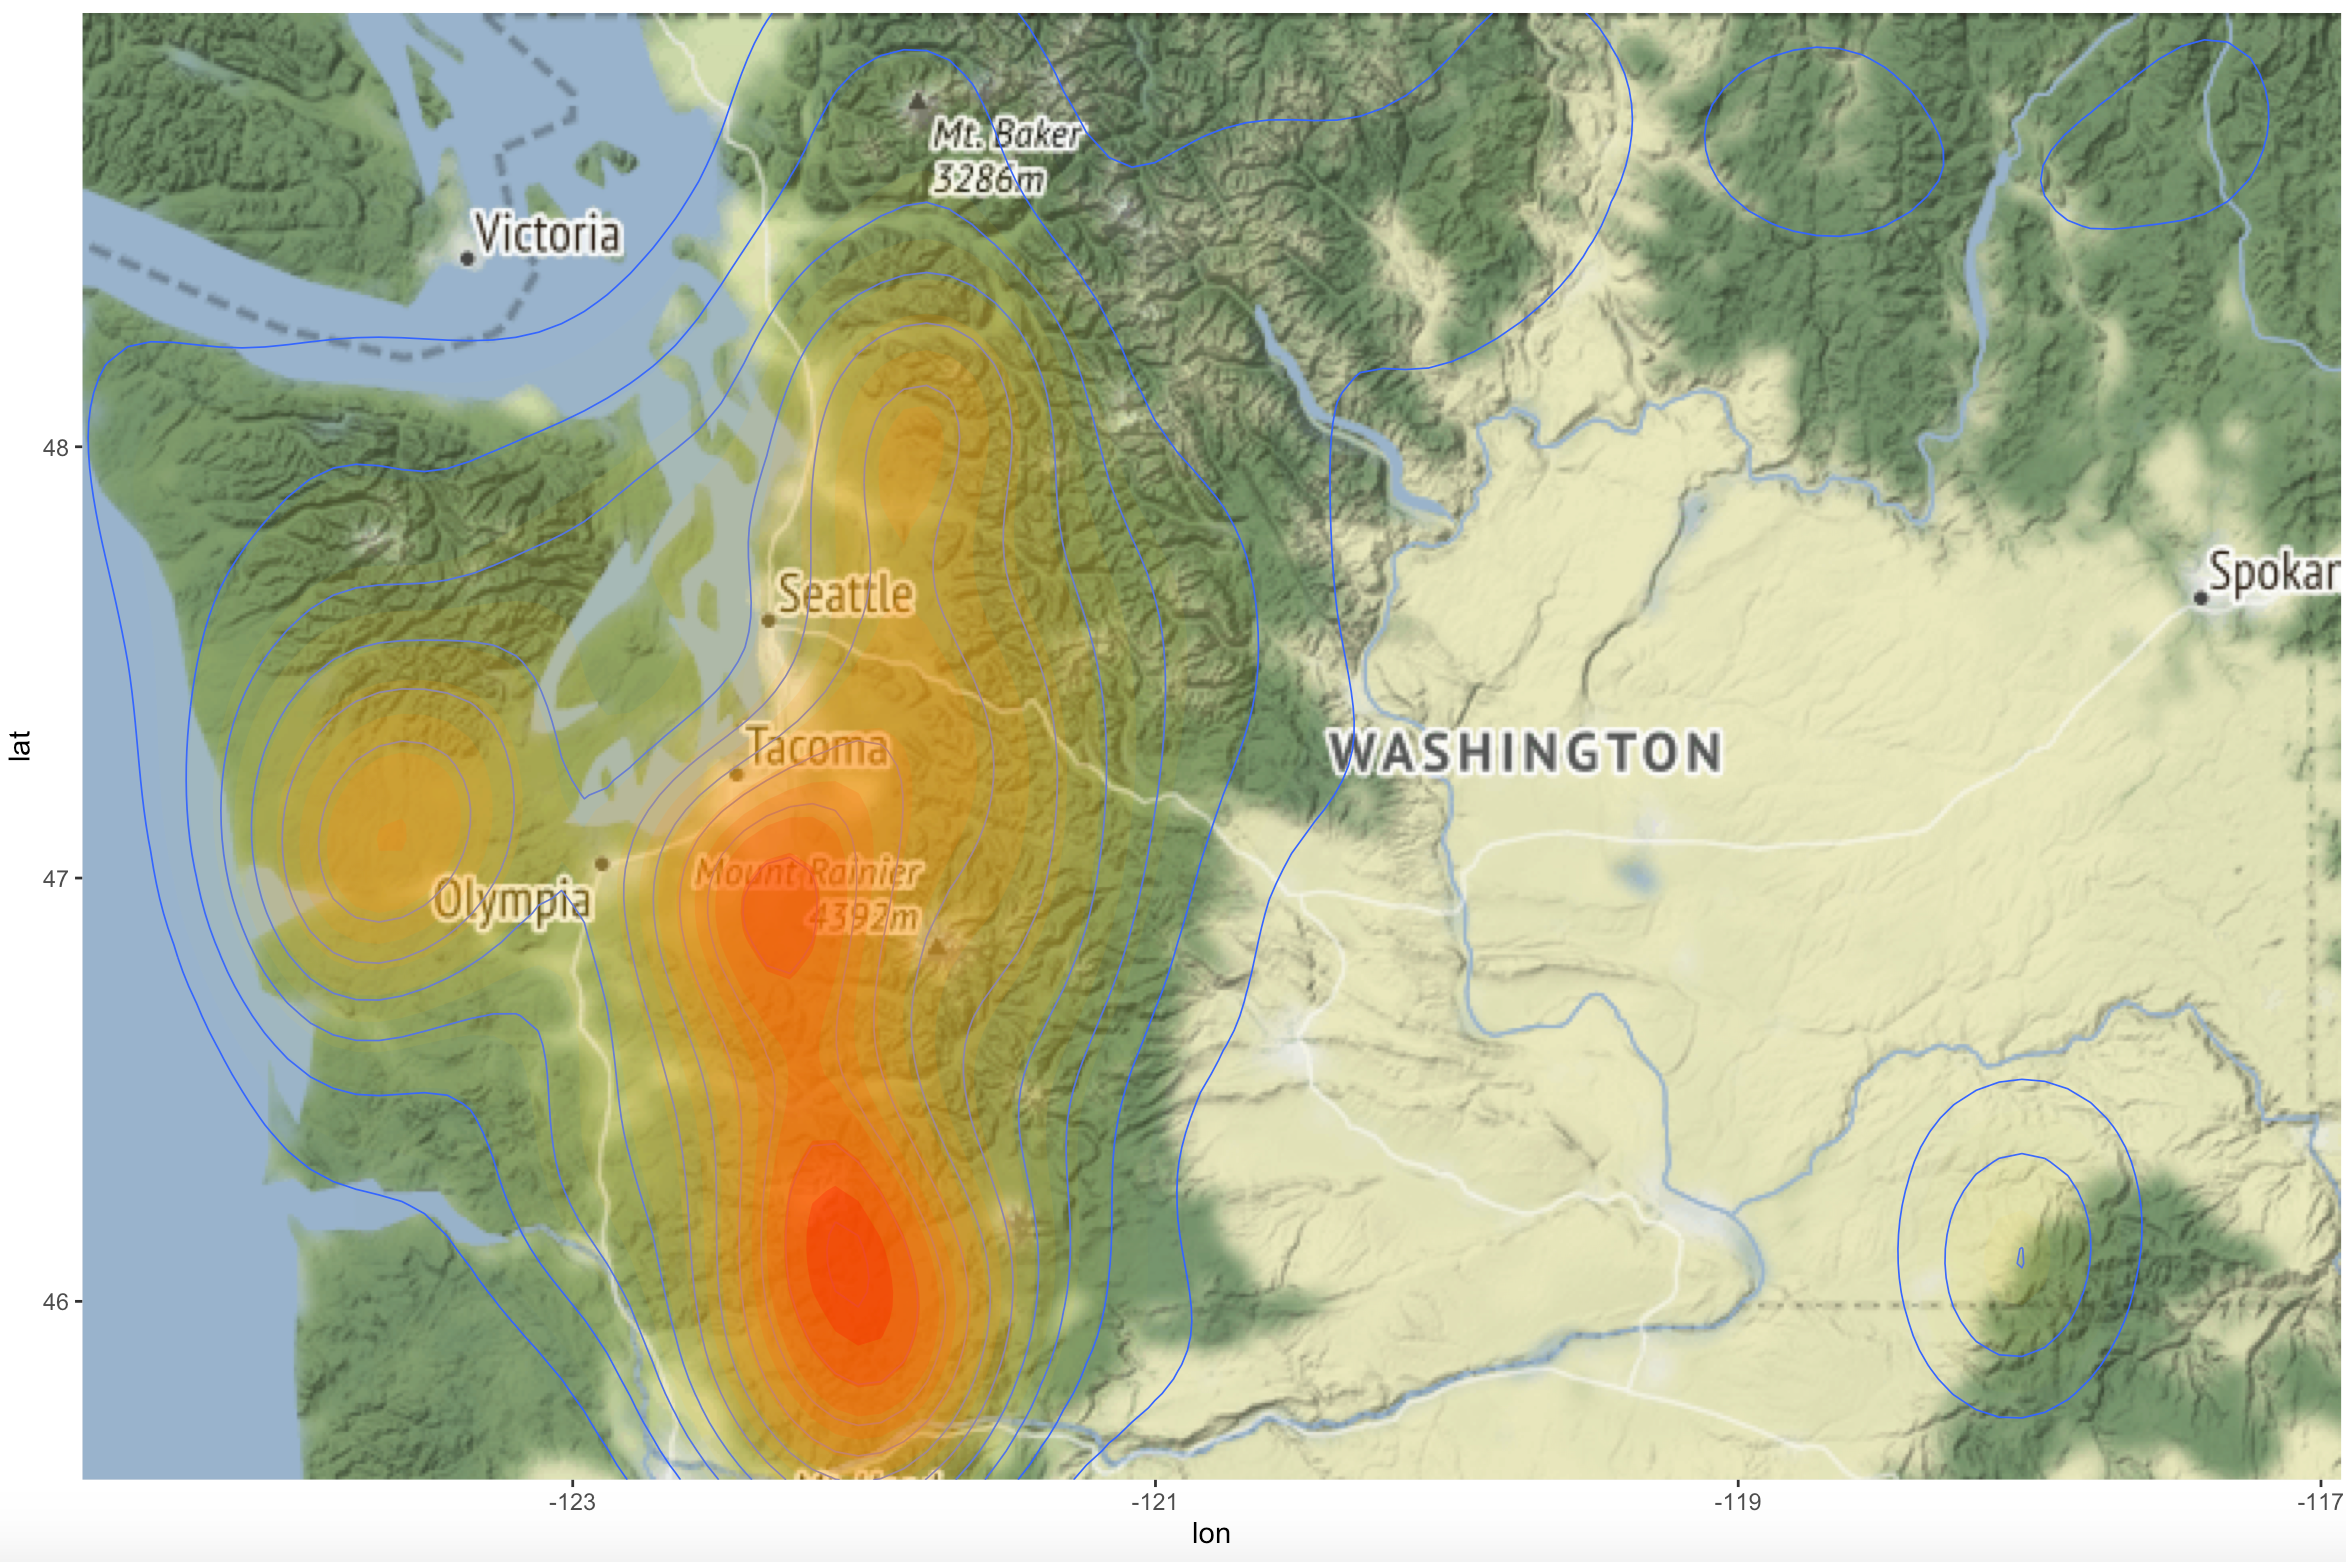
Sasquatch Sighting Heat Maps with R
Prior articles in this series Introduction to GIS Analysis using Sasquatch SightingsSpatial Squatch – Using the ArcGIS Pro Spatial Statistics Toolbox to Identify Sighting PatternsMapping Clusters of Sasquatch Sightings In this article I’ll deviate a little from...
4 New Training Bundles – Self-Paced and Live-Online
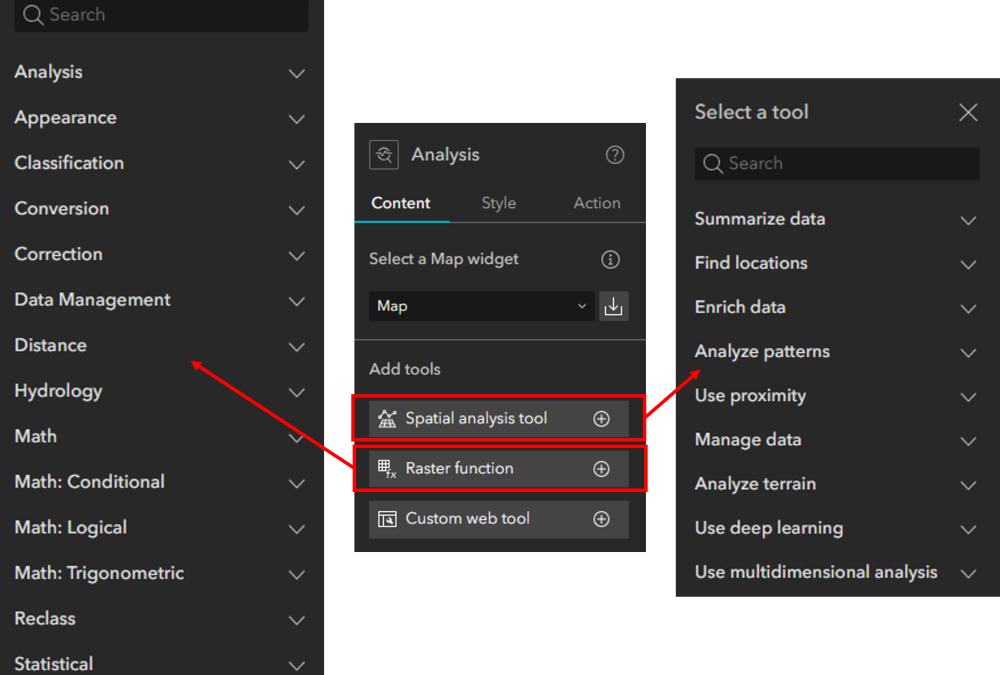
Today we’re announcing the availability of 4 new GIS training bundles for both self-paced and live-online GIS training opportunities. These new bundles will supplement our 2 existing bundles, and provide you with the ultimate flexibility for obtaining the latest...