
Free Tutorial Videos
Each month we release new tutorial videos covering a broad range of topics from ArcGIS Pro and ArcGIS Online, to Python, Arcade, Experience Builder and more. Browse the gallery below which represents the more than 100 tutorial videos hosted on our YouTube Channel, or...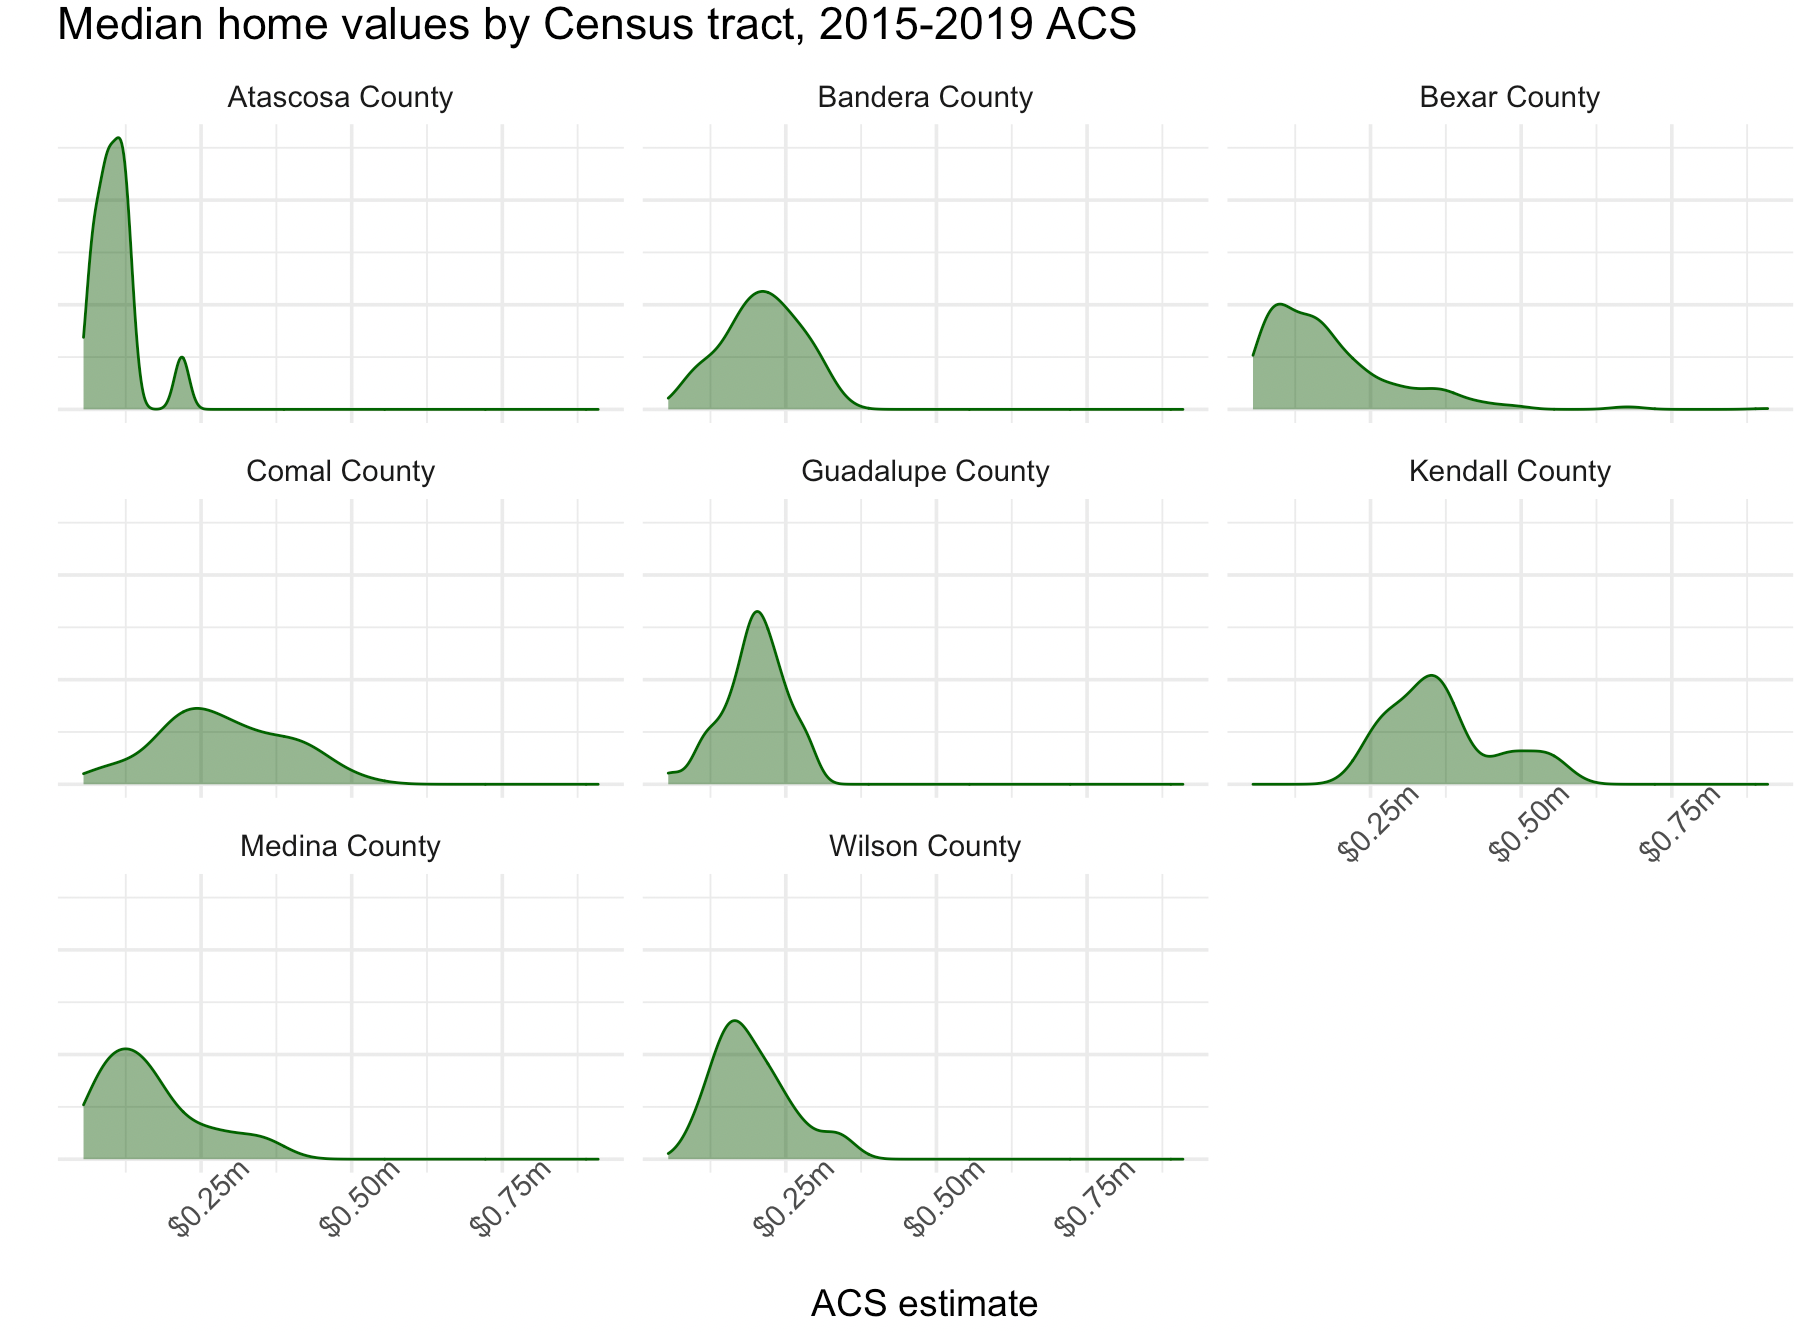
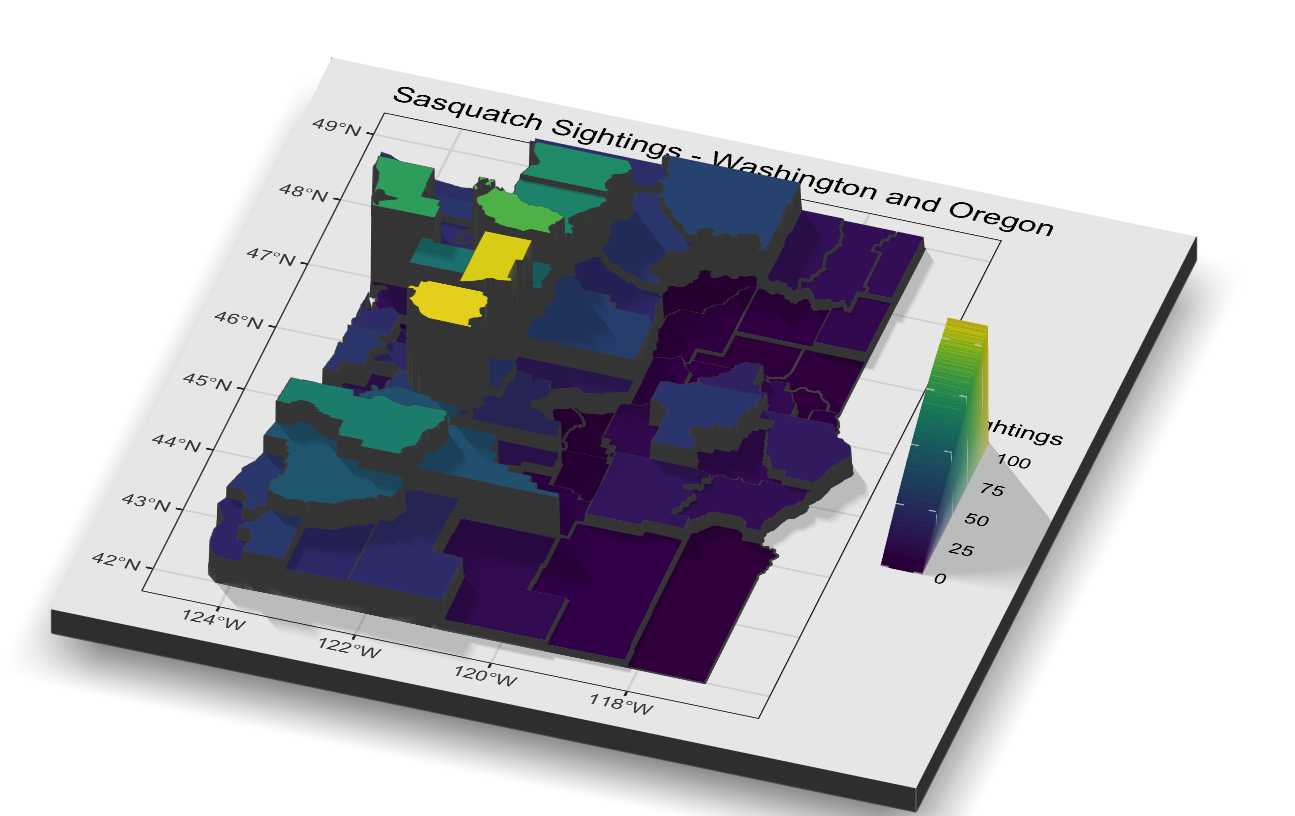
Visualizing Home Values in Texas with R
Many of our readers regularly work with U.S. Census data for mapping and analysis purposes. Whether you work with these datasets every day or just every now and then to create a map or graph you’ve no doubt discovered how difficult it can be to decipher census table...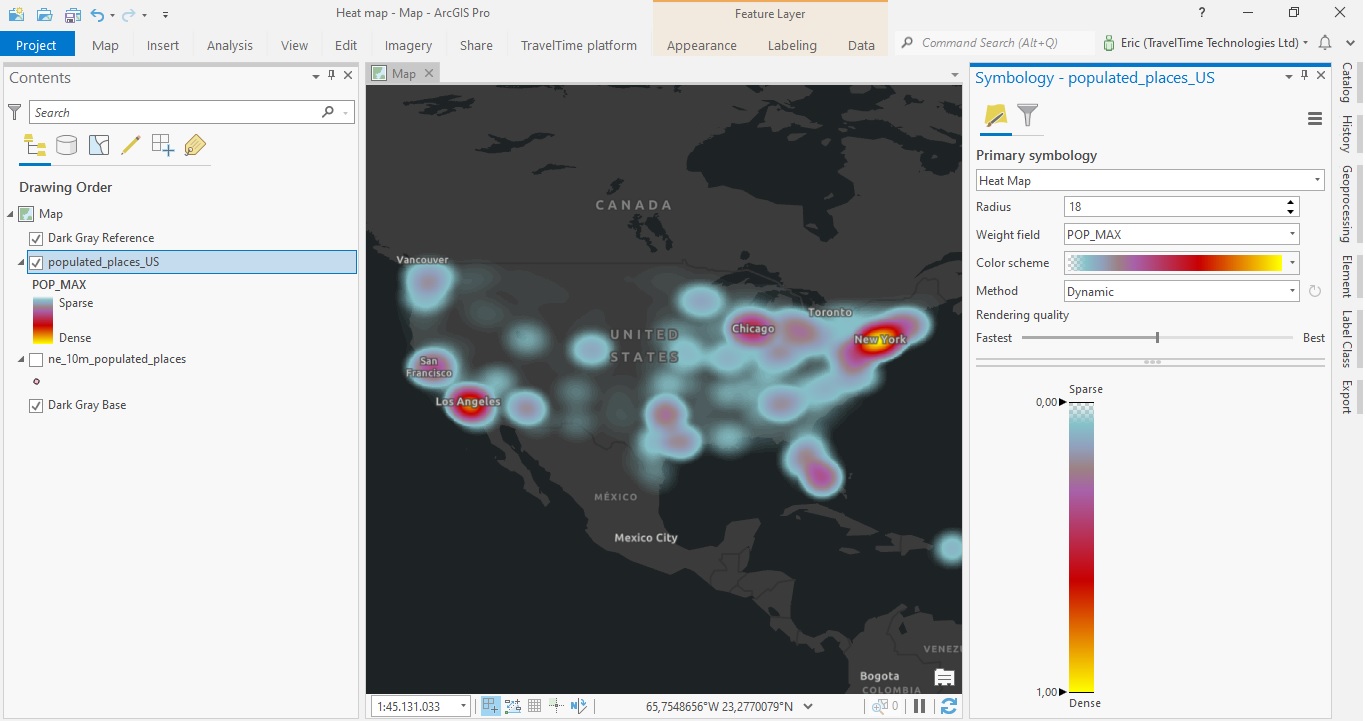
Tutorial – Creating a Heat Map in ArcGIS Pro
In this tutorial, you will learn how to create a heat map in ArcGIS Pro. This heat map will display the distribution of individual points that represent populated areas in the US. Using population values as a weight field, we can visualize the highest populated areas...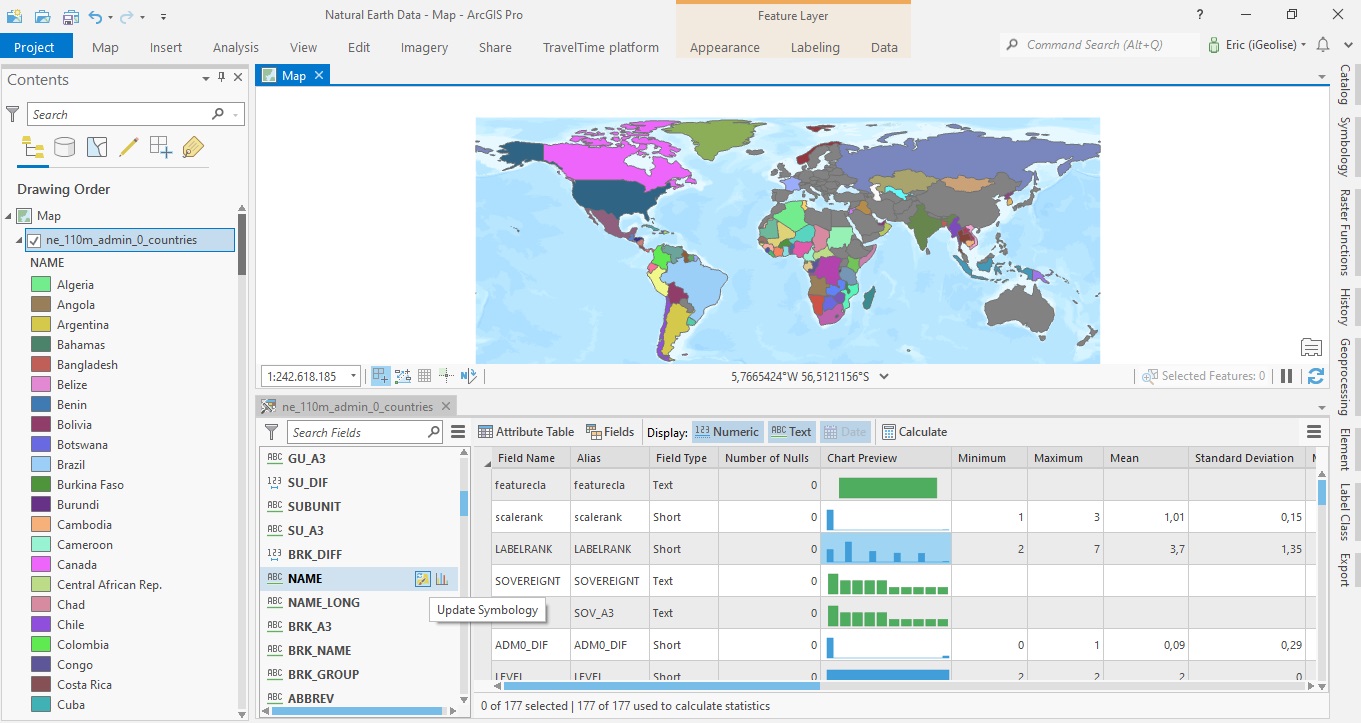
ArcGIS Pro 2.8 Data Engineering Tutorial
ArcGIS Pro 2.8 comes with a new Data Engineering toolset. This tutorial demonstrates how to get started using data engineering in ArcGIS Pro. To follow along with the steps in this tutorial, download the Natural Earth quick start kit and create a new folder connection...