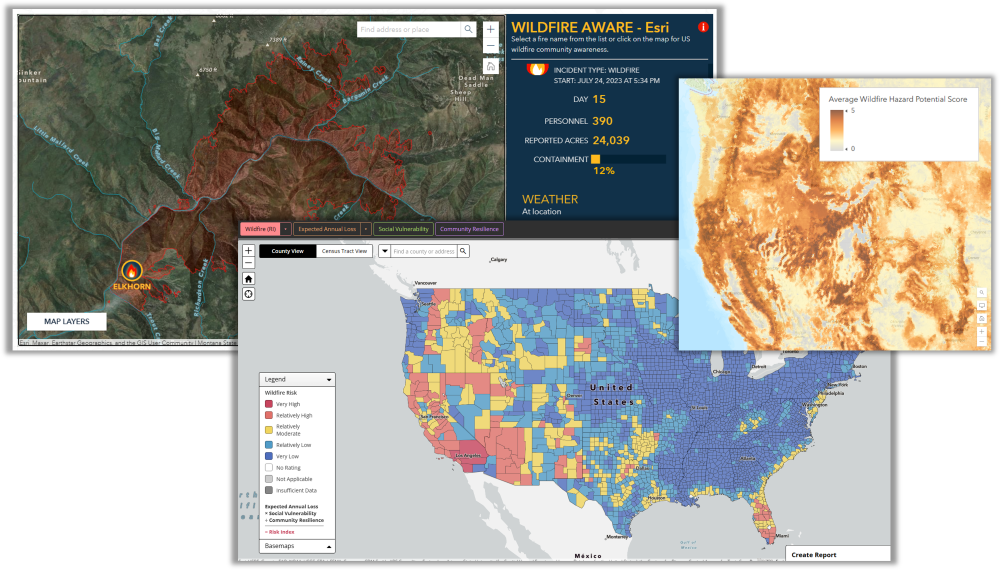
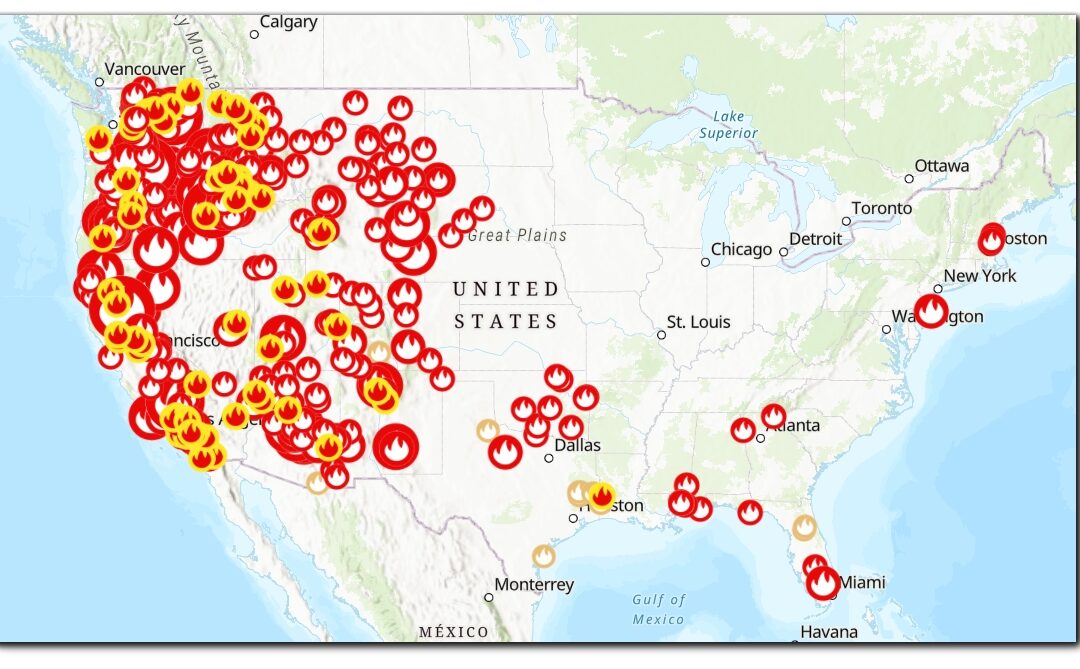
How to stream live Wildfire Data in your maps in ArcGIS Pro
Statistics show that wildland fires are igniting more frequently and causing more damage with each passing year. From the forest-surrounded communities of the western landscape and rural grasslands of the Midwest to the eastern states and wild areas of our National...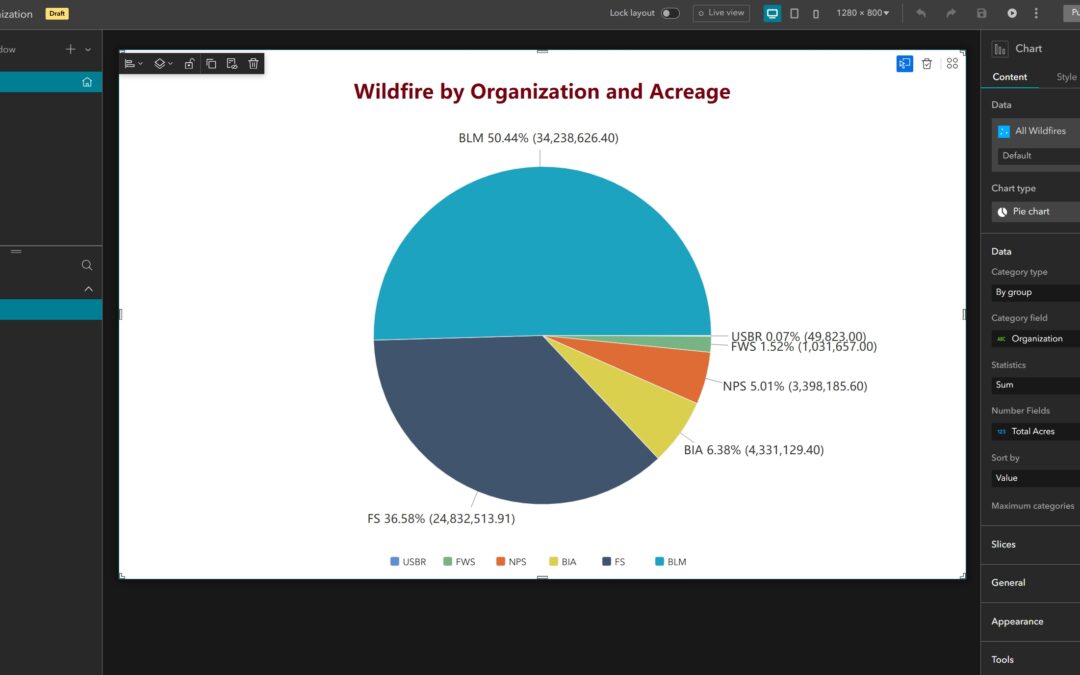
Advanced Pie Chart Customization in Experience Builder
Learn more about our Experience Builder courses and upcoming training schedule. Until recently, chart customization in Experience Builder has been lacking. Because of this, we often recommended embedding an Operations Dashboard in an Experience Builder application...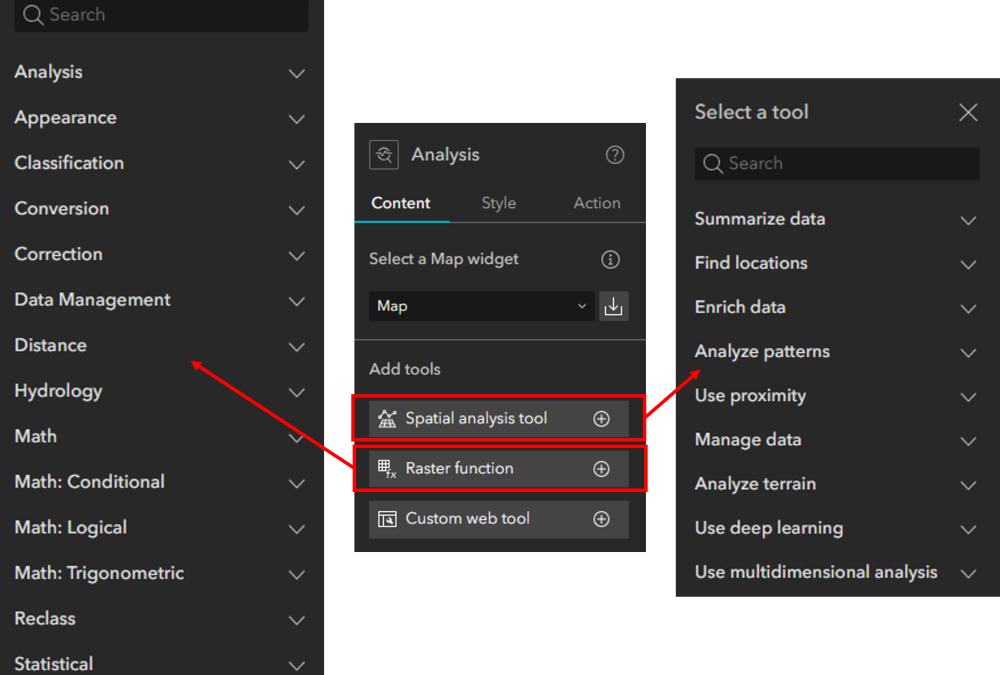
Analysis Widget Overview for Experience Builder
Viewing data summaries can be powerful, but spatial analyses can provide an even deeper understanding of data, relationships, and location. I won’t go into detail about the benefits of spatial analysis because I would be preaching to the choir. Because of this,...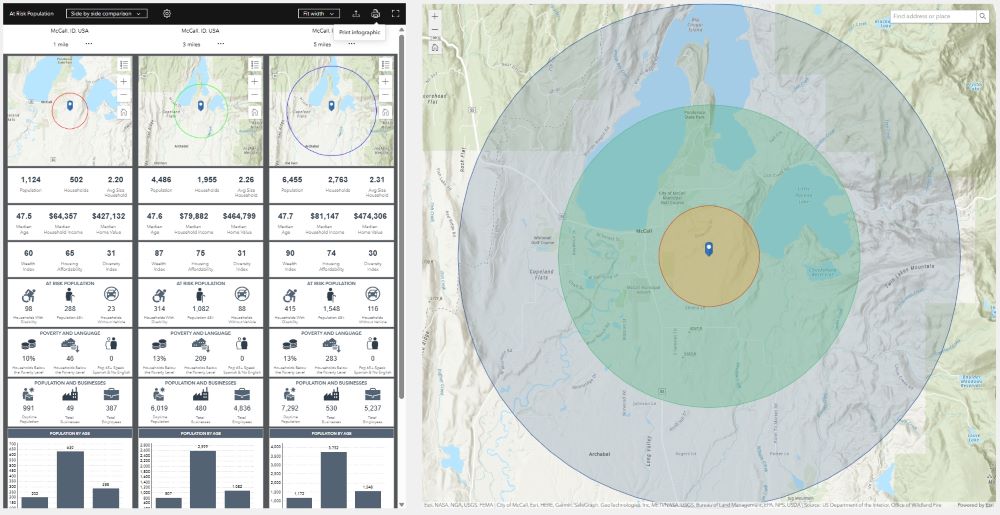
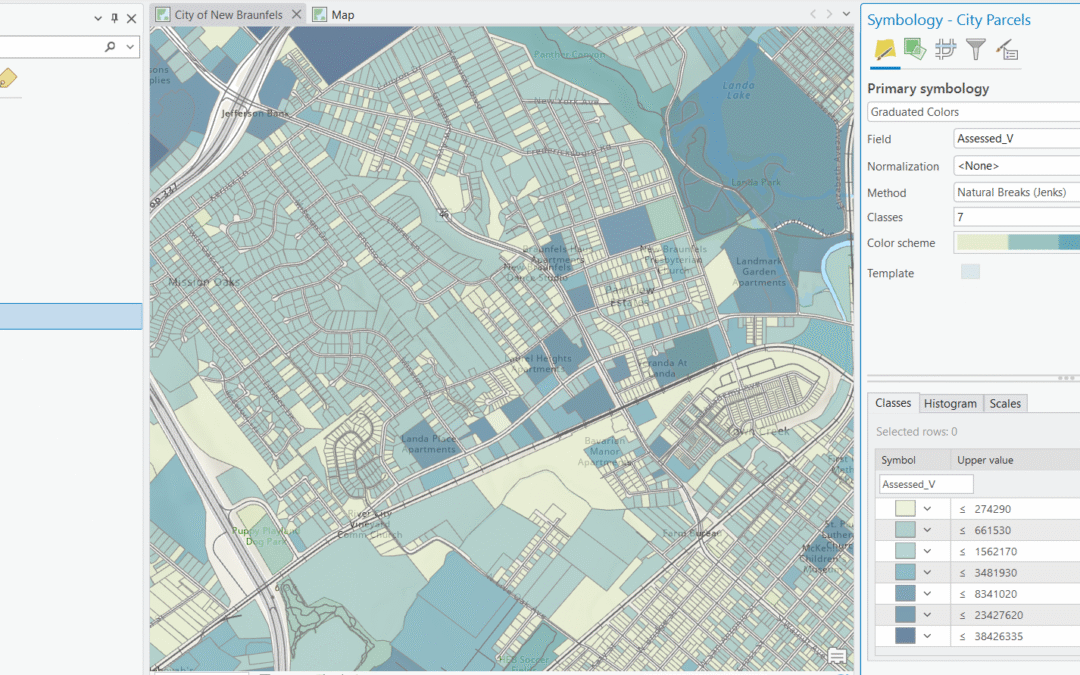
Some things to know about Business Analyst Widget in Experience Builder
The Business Analyst widget helps us visualize key indicators and data about locations using interactive infographics. These ready-to-use infographics can be used in ArcGIS Business Analyst Web App or ArcGIS Community Analyst with additional licensing, or you can...