

GIS resources to help you explore, analyze, and understand your risk.
Wildland Fires are becoming more frequent with higher destruction rates relative to land and property. Many of the most destructive fires in terms of financial loss have occurred since 2017. Here are some statistics with references published on BankRate.com:
- 4.5 million U.S. homes are at high or extreme risk from wildfires, with over 2 million in California alone. (Verisk)
- There were 66,255 wildfires in 2022, which affected 7.5 million acres, compared to just 18,229 wildfires and 1,323,666 acres lost in 1983 when official record-keeping began. (NCEI)
- There was a 17 percent increase from 2019 to 2021 in U.S. wildfires and a 223 percent increase since 1983. (NFIC)
- Humans cause as many as 85 percent of wildfires, with the remaining 15 percent caused by lava and lightning. (U.S. Department of Interior)
- Wildfires, drought, and heatwaves accounted for $20.36 billion in economic losses and $8.69 billion in insurance losses in 2021. (Insurance Information Institute – Triple-I)
- To date in 2023, there have been 17,292 wildfires with over 498,820 acres burned. (NFIC)
How can I determine my Wildland Fire Risk?
ESRI’s Living Atlas has an abundance of data layers that can help you determine your personal and community Wildland Fire Risk, and there are already-existing GIS resources from ESRI and two of the most authoritative organizations in Wildland Fire Risk: Federal Emergency Management Agency (FEMA) and National Interagency Fire Center (NIFC).
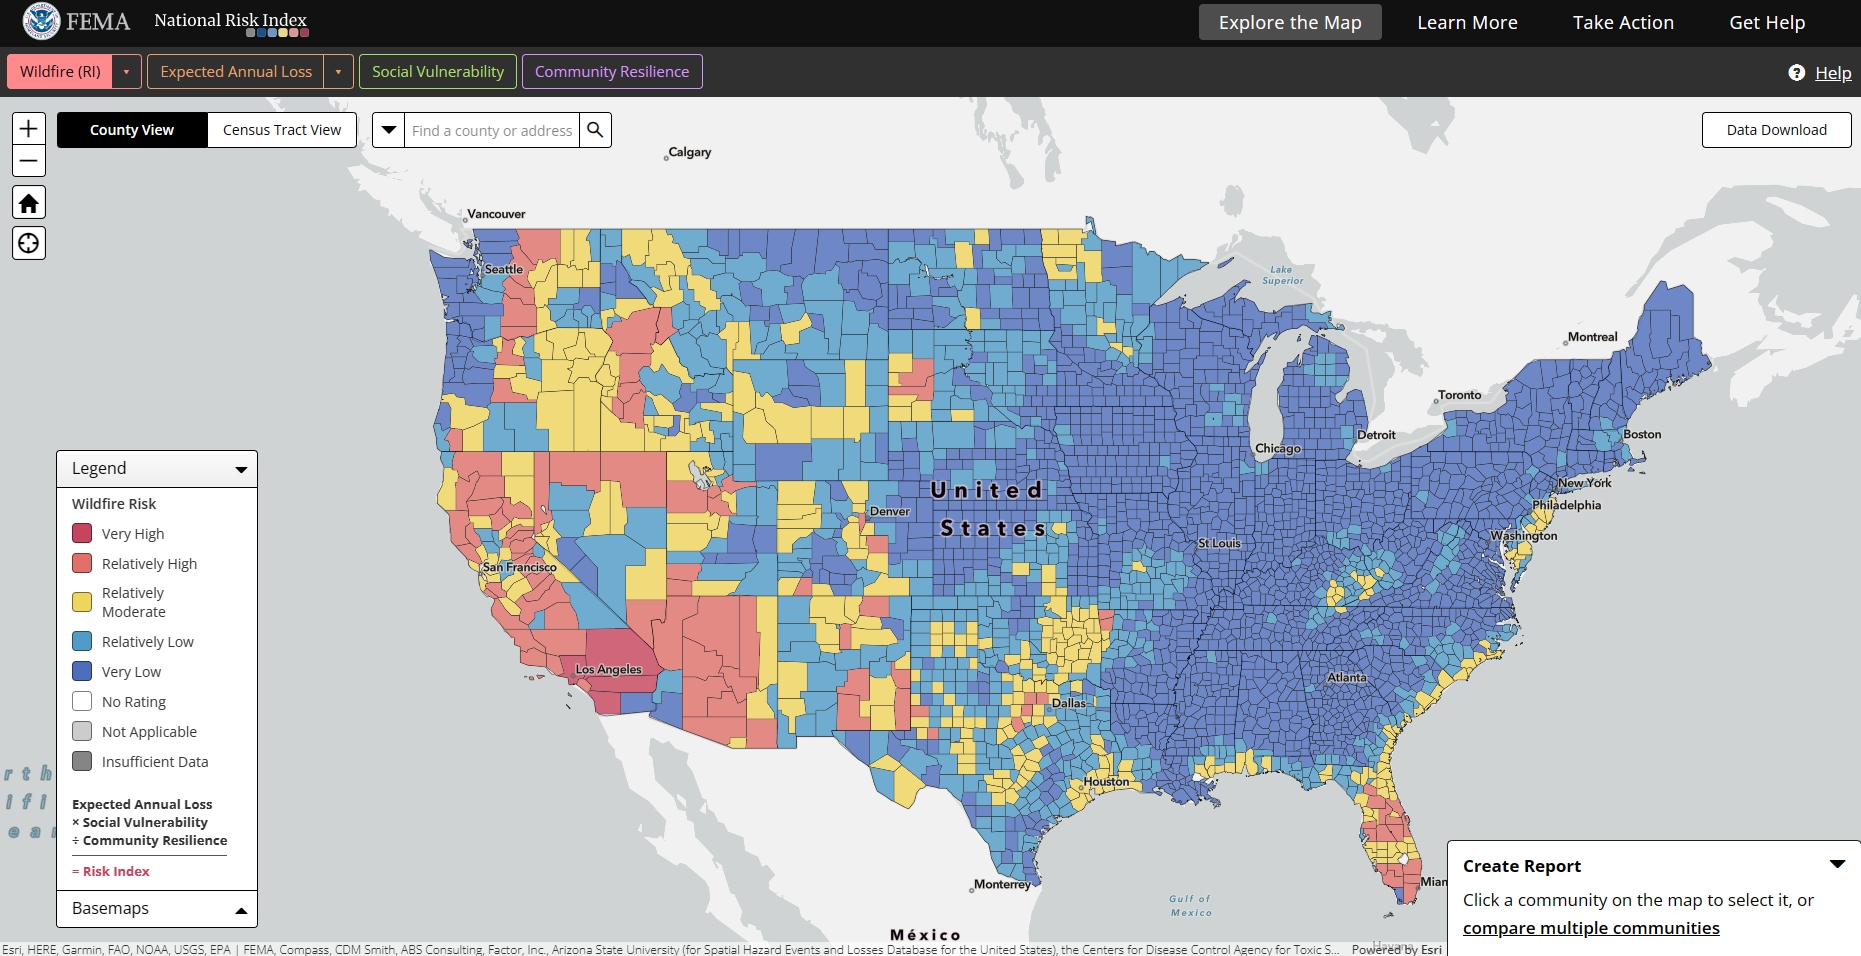
FEMA’s National Risk Index Map
FEMA’s National Risk Index Map will show you what your calculated risk is relative to Wildland Fire, Expected Annual Loss, Social Vulnerability, and Community Resiliency. The interactive map can give you a good idea for your surrounding area but is based on County-level data, so may not be very meaningful if you want to analyze risk a little closer to home.
The Wildland Fire Risk is based on the following formula:
Wildland Fire Risk = Expected Annual Loss x Social Vulnerability / Community Resiliency
Once you select your County, you can generate a thorough report on all the categories, statistics, and values associated. Use the following link to access FEMA’s resource: Map | National Risk Index (fema.gov)
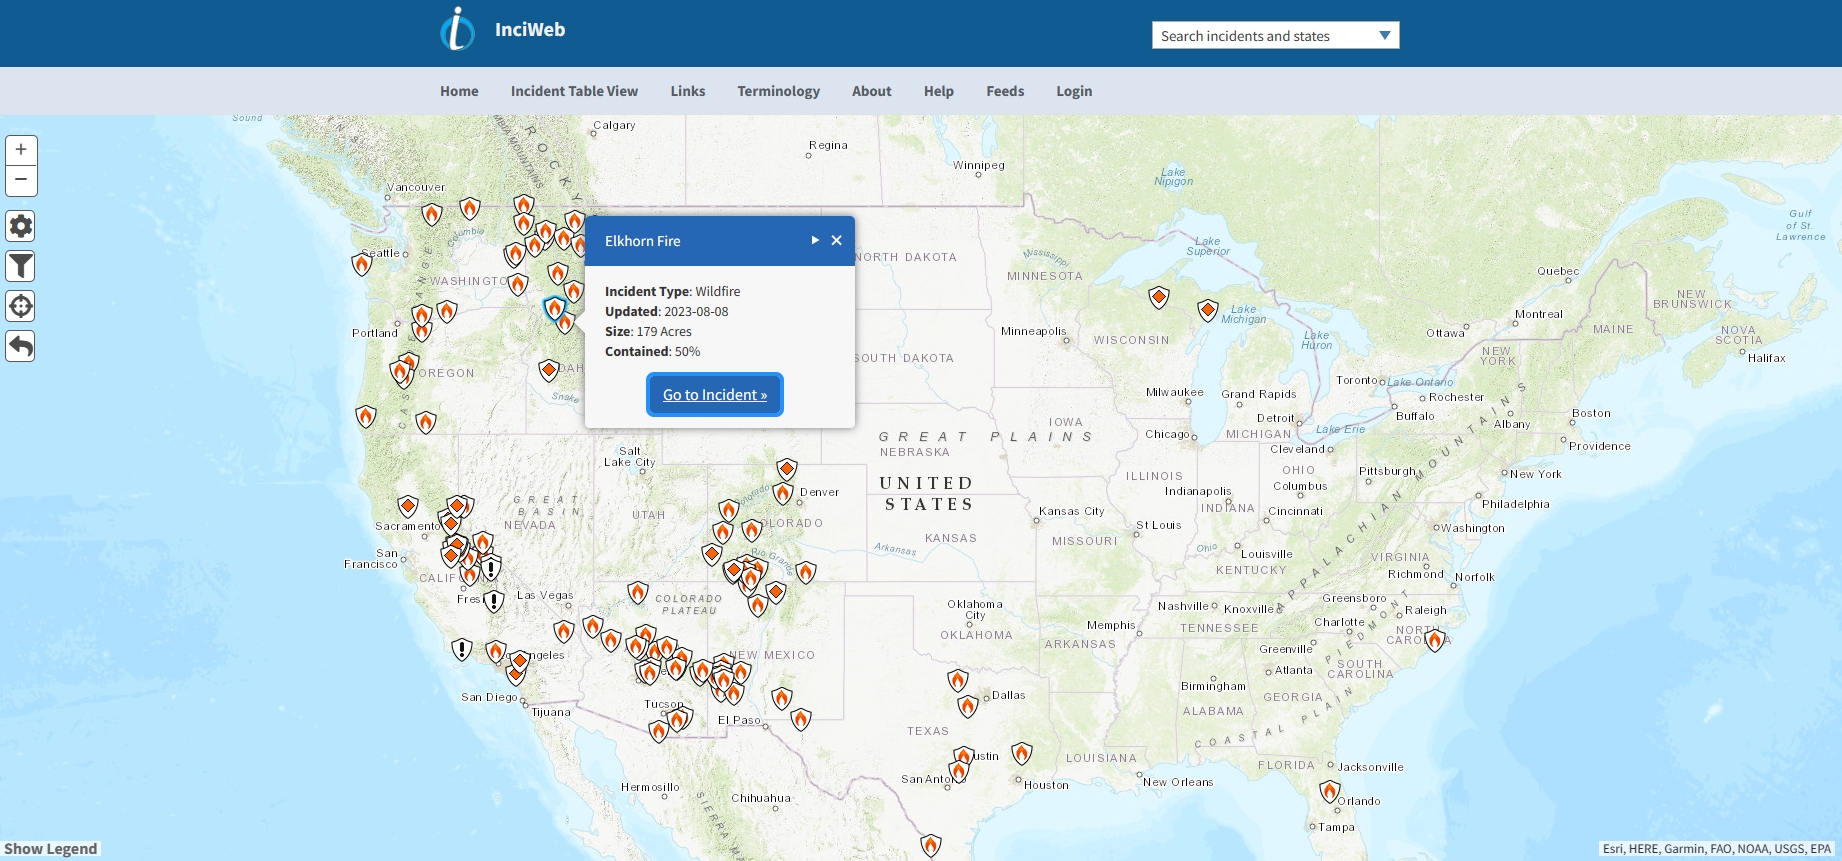
NIFC’s Fire Situational Awareness Resources
Part of your real-time wildland fire risk is whether or not there are active fires near you and your community. NIFC is the authoritative source for all wildland fire data and their InciWeb interactive map has been the premiere go-to resource for fire staff and agencies for many years. The map is simple and effective, giving the user the ability to view the distribution of active wildland fires with a pop-up button that will take you to a highly detailed report of each fire. This report includes contact information, announcements, images, and more.
Use the following link to access NIFC’s InciWeb map: InciWeb the Incident Information System (nwcg.gov)
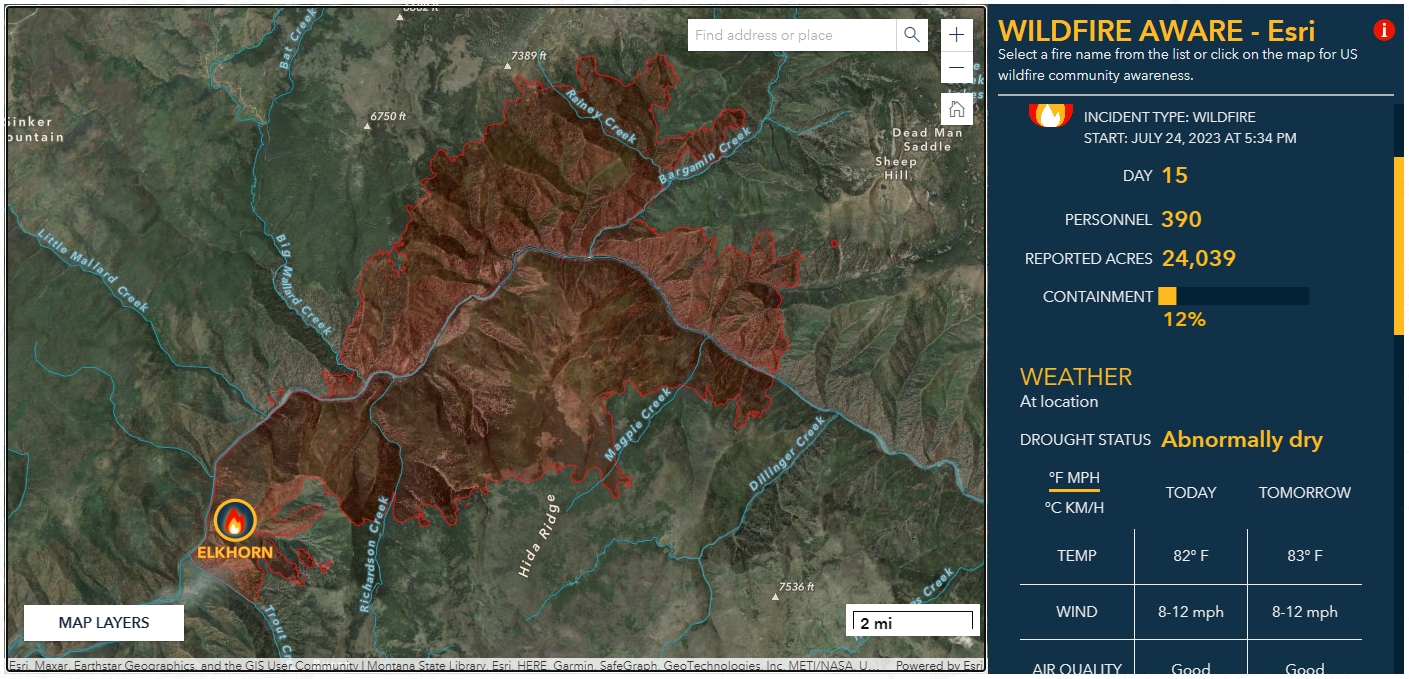
ESRI’s Living Atlas & Disaster Response Program
Similar to NIFC’s InciWeb, ESRI has a Disaster Response Program map that shows real-time information and updates about active wildland fires. The map is beautifully curated and user-friendly, providing a panel for selected incidents that will show important information such as Start Date, Number of Personnel, Number of Acres Burned, Percent Contained, Drought status for the area, and more. To visit the Disaster Response Program and view the map referenced here, as well as other resources, visit the following URL: Wildfire Maps & Response Support | Wildfire Disaster Program (esri.com)
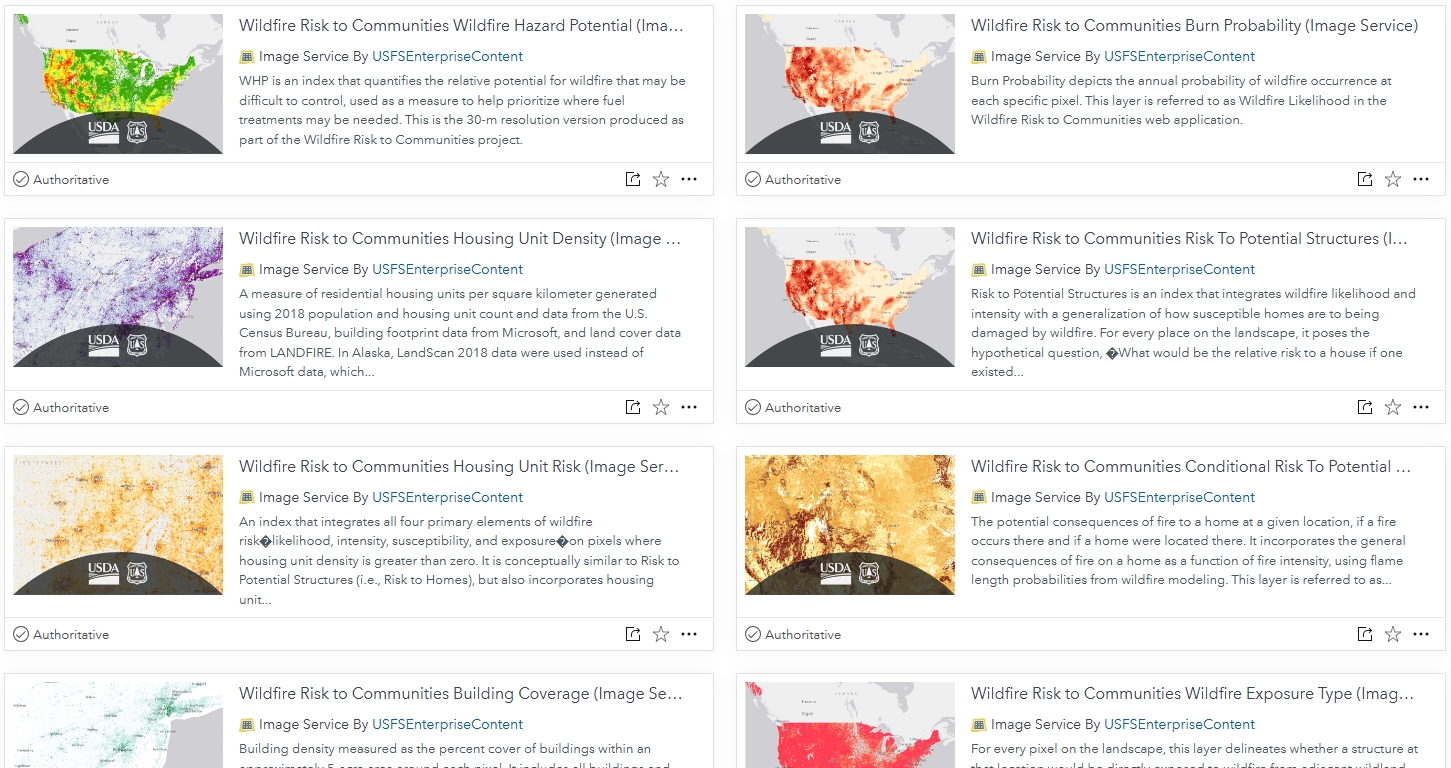
If you are like us, then you love to explore the data yourself. Luckily, there are more than 15 data layers in ESRI’s living Atlas that you can pull into your Map View or ArcGIS Pro project to explore and analyze. The list of layers includes:
- Wildfire Risk to Communities Wildfire Hazard Potential (Image Service)
- Wildfire Risk to Communities Burn Probability (Image Service)
- Wildfire Risk to Communities Housing Unit Density (Image Service)
- Wildfire Risk to Communities Risk To Potential Structures (Image Service)
- Wildfire Risk to Communities Housing Unit Risk (Image Service)
- Wildfire Risk to Communities Conditional Risk To Potential Structures (Image Service)
- Wildfire Risk to Communities Building Coverage (Image Service)
- Wildfire Risk to Communities Wildfire Exposure Type (Image Service)
- Wildfire Risk to Communities Flame Length Exceedance Probability – 8 foot (Image Service)
- Wildfire Risk to Communities Conditional Flame Length (Image Service)
- Wildfire Risk to Communities Flame Length Exceedance Probability – 4 foot (Image Service)
- Wildfire Risk to Communities Population Density (Image Service)
- Wildfire Risk to Communities Housing Unit Impact (Image Service)
- Wildfire Risk to Communities Housing Unit Exposure (Image Service)
- Wildfire Risk to Communities Building Exposure Type (Image Service)
- Wildfire Resilience Census Tracts
To access these Living Atlas services, click on the following link: ArcGIS Living Atlas of the World.
We hope you have enjoyed this article. Please sign up for our Newsletter so you can get our announcements, articles, and tutorials directly to your inbox: http://eepurl.com/bPXsm1
