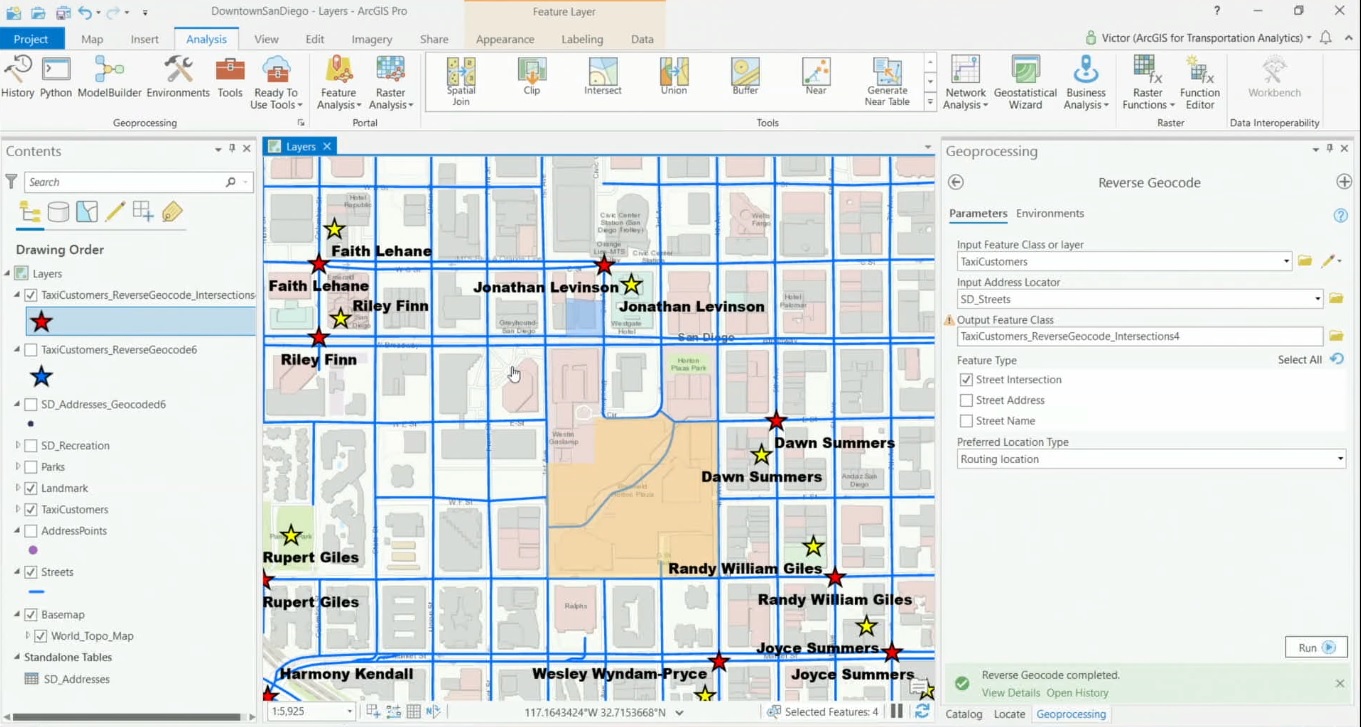
Spatial Machine Learning with ArcGIS Pro
Now that machine learning algorithms are available for everyone, they can be used to solve spatial problems. ArcGIS Pro offers different Spatial Machine Learning tools that enable classification, clustering and prediction of spatial data. Traditional Machine Learning...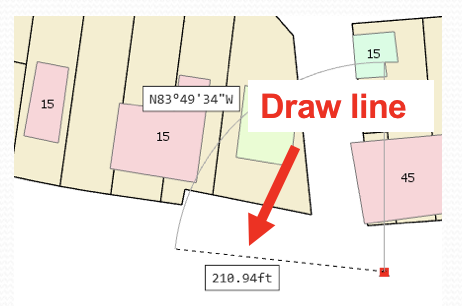
New Class – Editing Data in ArcGIS Pro
Why do you need or want to edit data in a GIS? For some the answer may seem obvious. But take a quick moment to think about it. One of my favorite questions that normally comes from managers or elected officials is “When will our GIS be done?”, as if a GIS is a house...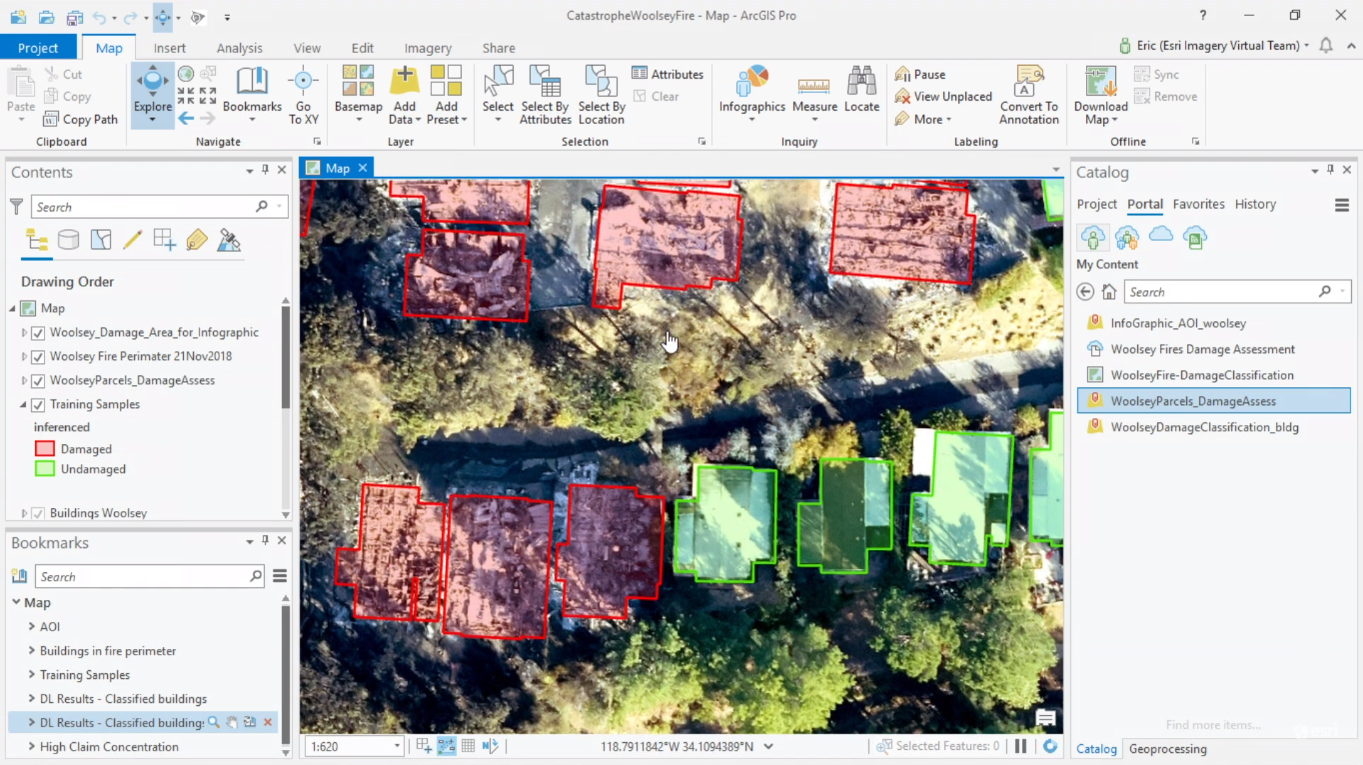
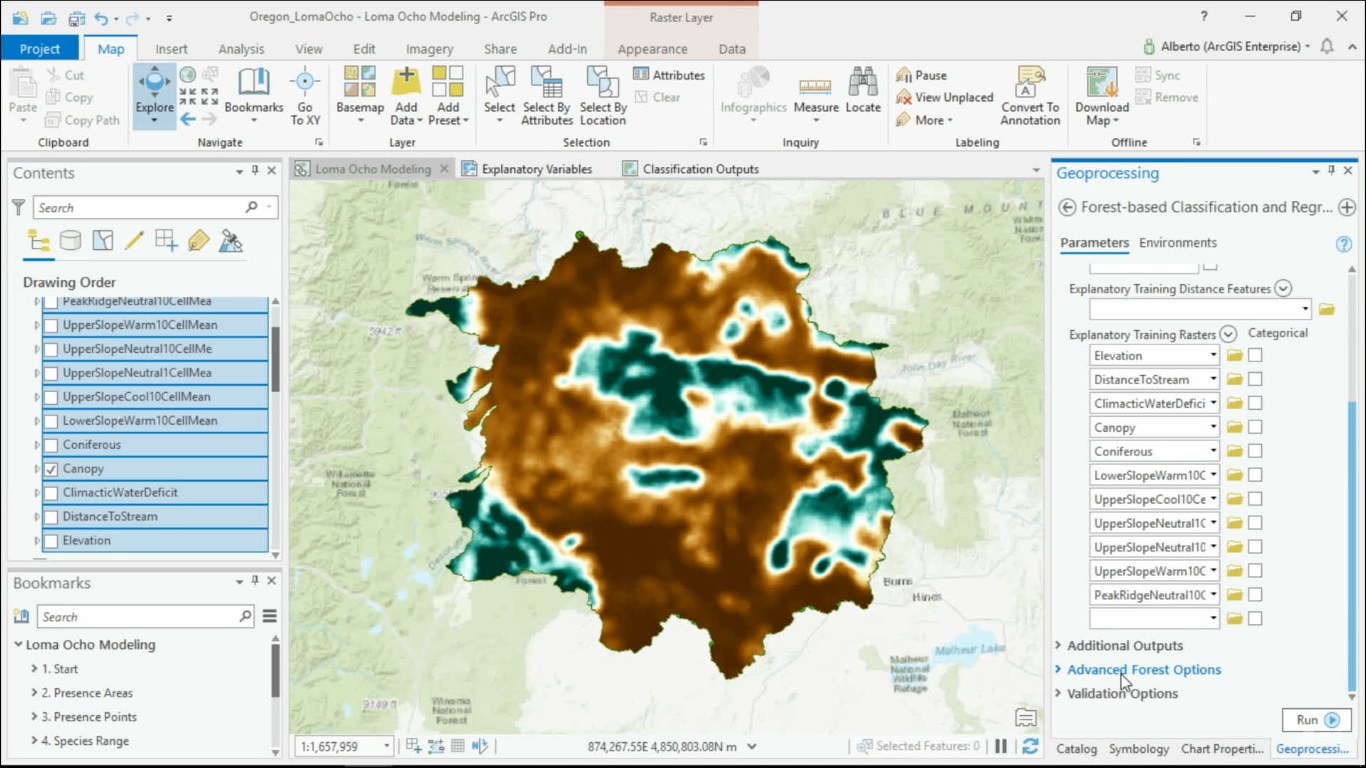
Training a Deep Learning Model using Drone Imagery and ArcGIS Pro
This year’s Esri User Conference plenary sessions featured a presentation showing how an insurance company in San Antonio, Texas uses ArcGIS Pro to train neural deep learning networks, in order to automate and speed up damage assessment and building footprint...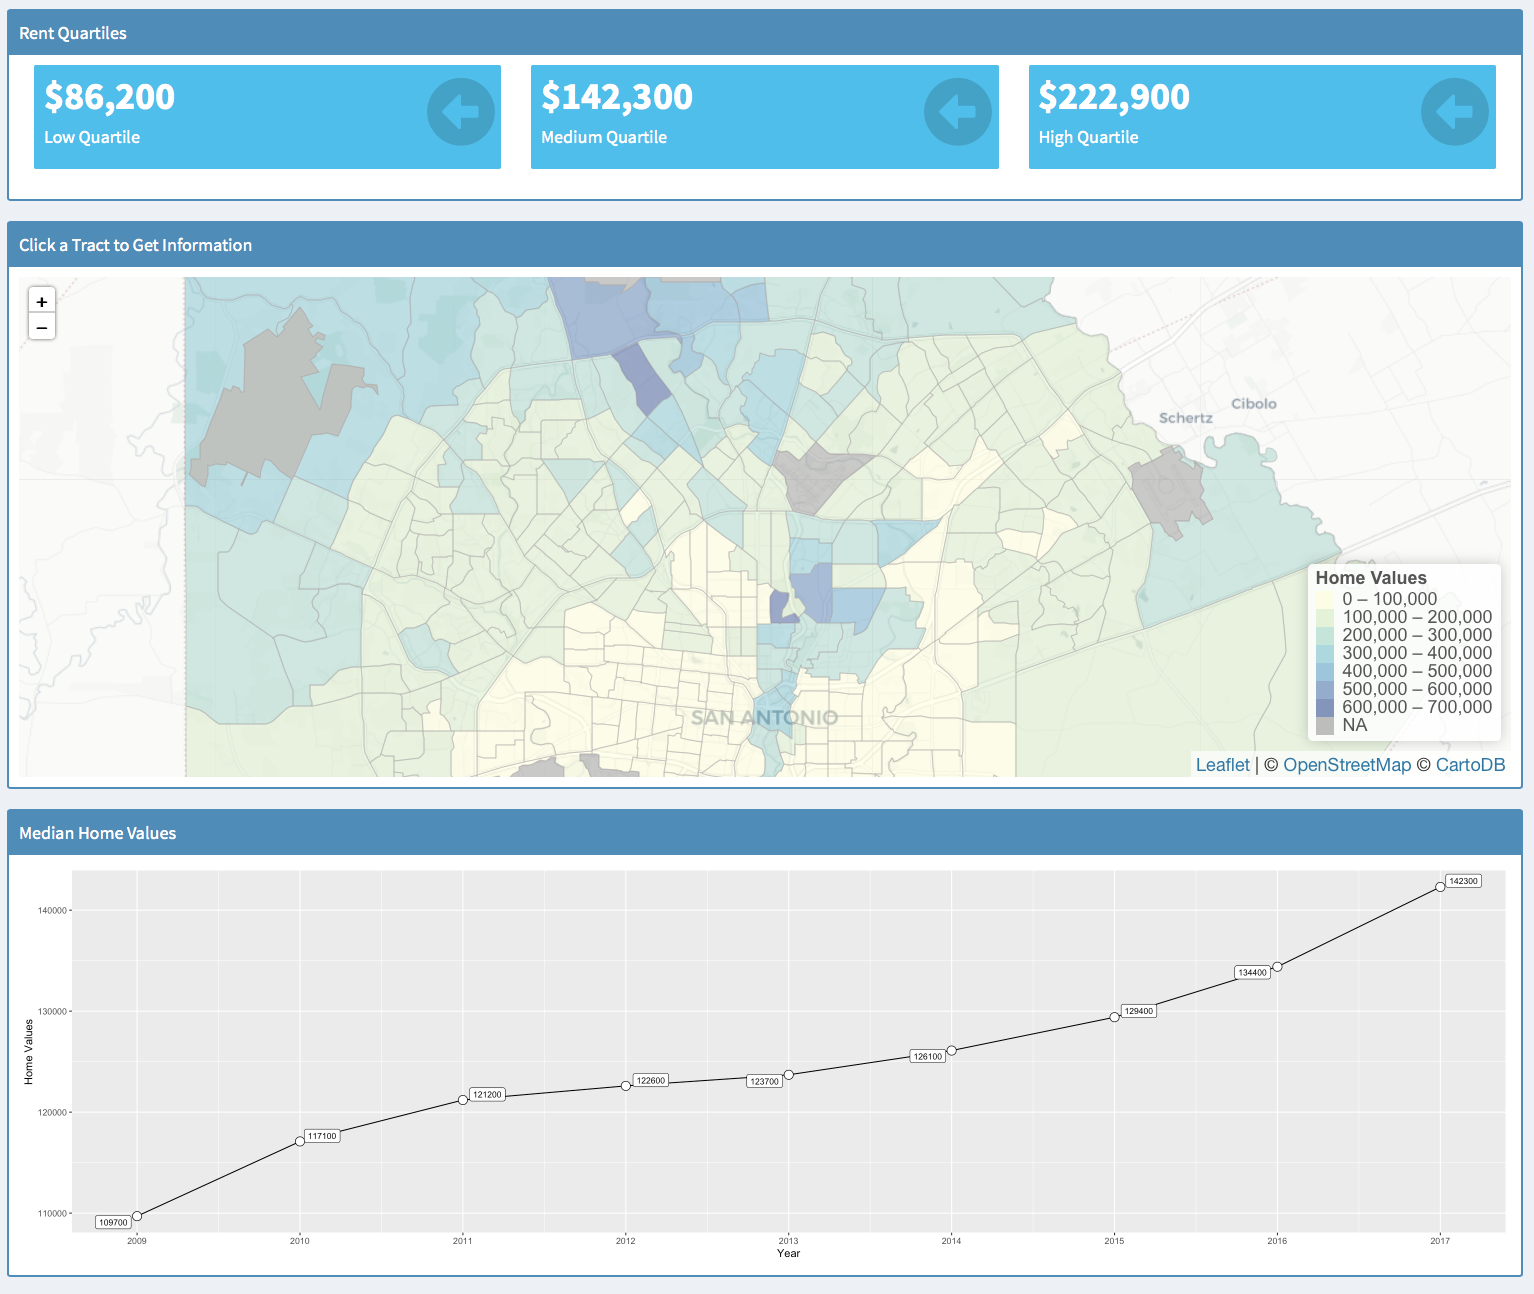
New Book Coming Soon – Exploring and Visualizing US Census Data with R
This November (2019) my new book – Exploring and Visualizing US Census Data with R will be published. You can get a free copy of the digital version of this book simply by entering your email address. The book will be delivered to your email inbox no later than...