
This is a guest post by Fred Lott and was originally published on the GIS & You blog hosted by King County GIS.
There is a wide array of powerful free open-source tools for doing data analysis, and many of them can now handle spatial data. This post will focus on using R, specifically the tidyverse packages, as a data exploration tool for analyses that would otherwise be cumbersome in a traditional desktop GIS program.
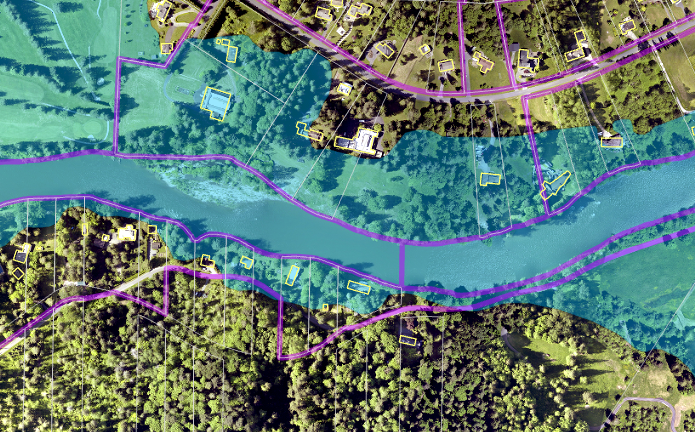
I am currently working on a project to improve counts of residents in hazard areas and to estimate their demographics from census data. A simple version of this analysis would be to overlay the hazard area with something like census blocks or parcels. However, for this project we are interested in hazard areas that directly affect buildings on a parcel. Moreover, the sequence of analyses needs to be flexible enough to easily drop in new or updated hazard layers and census information.
The project started off with data for the entire county: over 600,000 parcels, 35,000 census blocks, about 1 million building footprints, and various other spatial and tabular datasets. After trying out a few different tools for my analysis, I decided to go with R.
