This will be the first of multiple posts that explores how you can use R to efficiently load and visualize U.S. Census data using a variety of packages including tidycensus and tidyverse.
The US Census Bureau has made its datasets available to the public through a variety of APIs. You can get a sense of the datasets that are available through the APIs using its Discovery Tool. At last check there were some 369 datasets available. Vintage datasets are available as well. For example, you can take a look at 2010, 2000, and 1990. The currently available APIs for accessing these datasets can be found here.
R users will be excited to learn that the tidycensus R package can be used to interface with the US Census Bureau’s decennial Census and five-year American Community APIs and return tidyverse-ready data frames, optionally with simple feature geometry included. The inclusion of simple feature geometry makes it easy to combine this census data with packages such as leaflet and sf to quickly create thematic maps of census data. Of course you can also use the ggplot2 package from tidyverse to create an amazing array of other visualizations as well.
What is tidycensus?
As I mentioned above, tidycensus is an R package that facilitates the retrieval and loading of pre-prepared US census data with an optional parameter for returning simple feature geometry into a data frame style object suitable for visualizations including maps and graphs. There are other R packages as well that handle census data including censusapi and acs.
Installing tidycensus
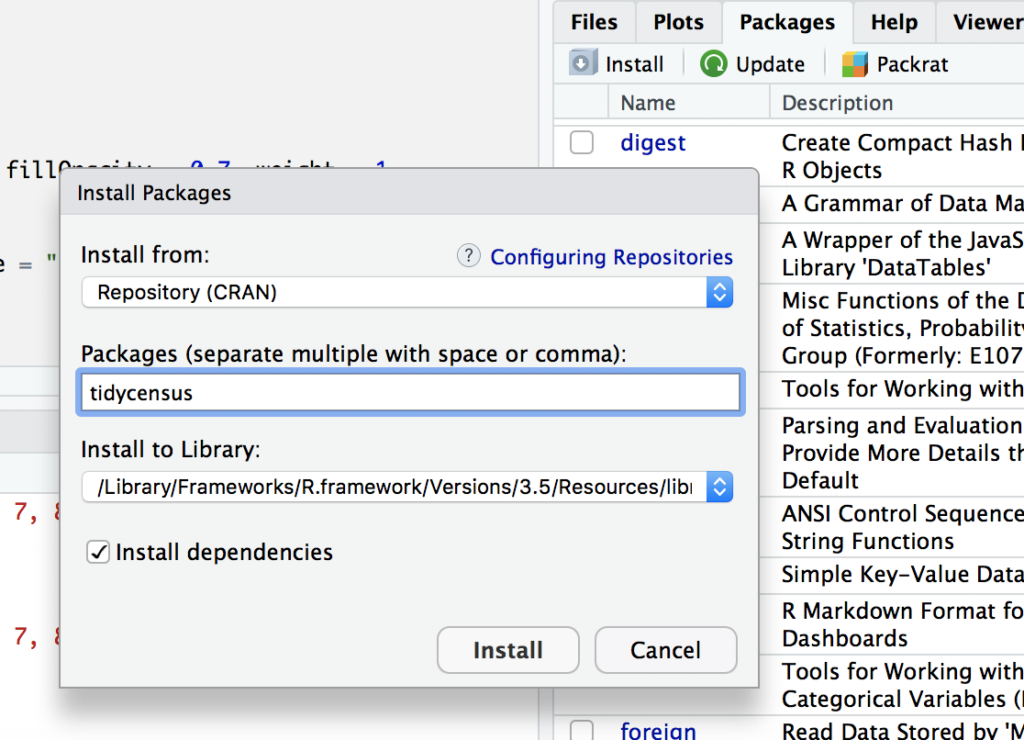
tidycensus is available on CRAN and you can browse the source code on GitHub. The easiest way to install tidycensus is to use the RStudio interface by clicking the Install button on the Packages tab as seen in the screenshot below.
After installing tidycensus you can load it into a script using:
library(tidycensus)
A Simple Example
Here I’ve linked to a simple example that I put together in RStudio and published to RPubs. You can take a look at the code in the linked document but I’ll briefly describe it here. We’ll go into much greater code detail in future posts. For now I just want you to get a sense of how quickly and easily you can retrieve and visualize this data.
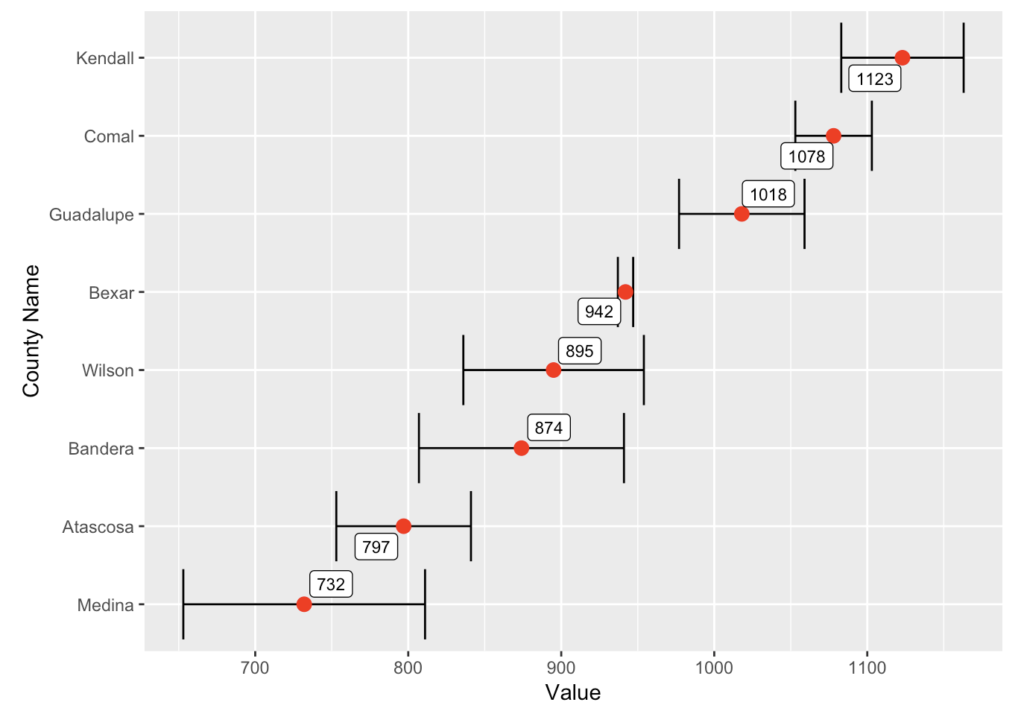
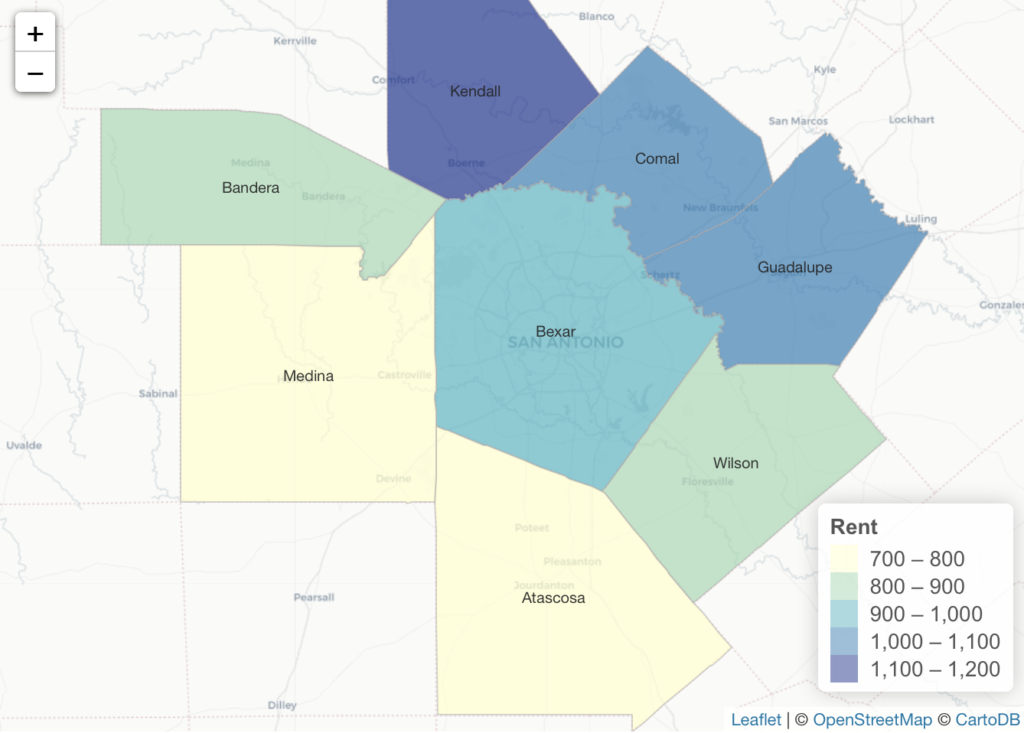
You can also see the output below. The data is retrieved using the get_acs() function in tidycensus, which returns a data frame object that we store in the dfRent variable. Here I’m mapping contract rent information (B25064_001 Census Bureau table) at a county level for the state of Texas. This will initially pull all counties for the state of Texas, but later in the code I’ll filter the data to include only counties for the San Antonio metropolitan area.
The dfRent data frame is then tidied up a bit by cleaning up the data values, filtering the rows (only counties in San Antonio metropolitan area), and arranging them in descending order. The dfRent variable is a data frame that contains the rent information for each county along with the simple feature geometry that will later be passed into the leaflet() function to create the map you see below.
After tidying up the dataset I then used the leaflet package to create a thematic map as seen below. The addPolygons() function is passed the dfRent variable, which contains the simple geometry
Using ggplot2 I also created a simple plot of the rent data along with error bars. The ggplot() function is passed the dfRent data frame along with a number of other configuration options which we’ll cover in more detail in a future post.