Our New Book – Fundamental ArcGIS Pro Skills: Workbook 2
Our new Fundamental ArcGIS Pro Skills: Workbook 2 has been published! The intermediate level book is the follow up to Fundamental ArcGIS Pro Skills: Workbook 1. If you’re ready to learn intermediate ArcGIS Pro including creating spatial and bookmark map series,...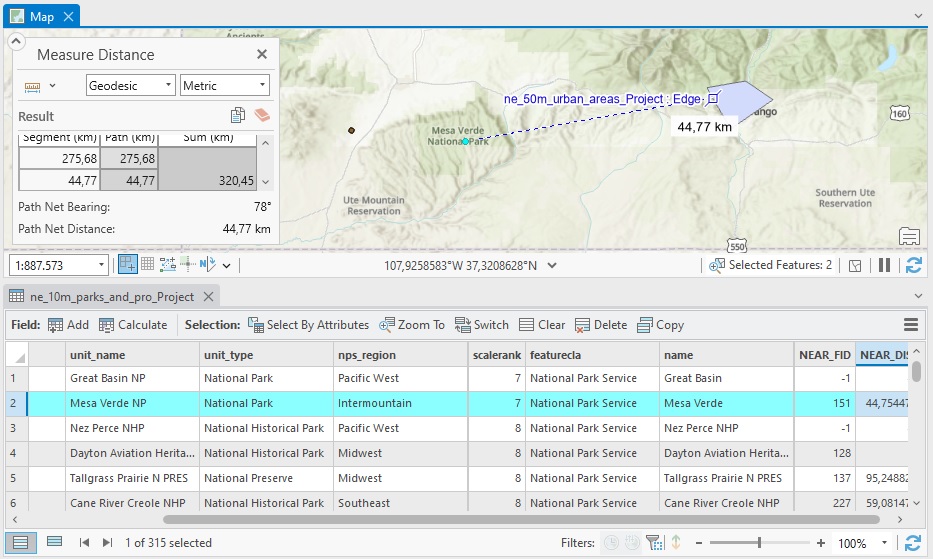
How to Calculate Distances Between Features in ArcGIS Pro
The Near geoprocessing tool in ArcGIS Pro calculates distances between features in different layers. We’ll demonstrate how this tool works using a point and polygon layer. To calculate the distance between two features you could use the measure tool that is available...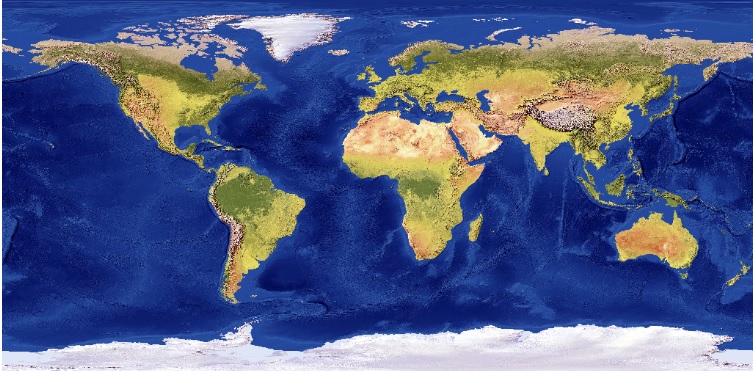
Convert a Raster or Vector Layer to KML in ArcGIS Pro
This tutorial covers a recently enhanced conversion tool in ArcGIS Pro to convert a raster or vector layer to KML in ArcGIS Pro. In ArcGIS Pro 3.x, the Layer to KML tool is enhanced to allow you to convert feature layers to basic KML files. We’ll describe how that...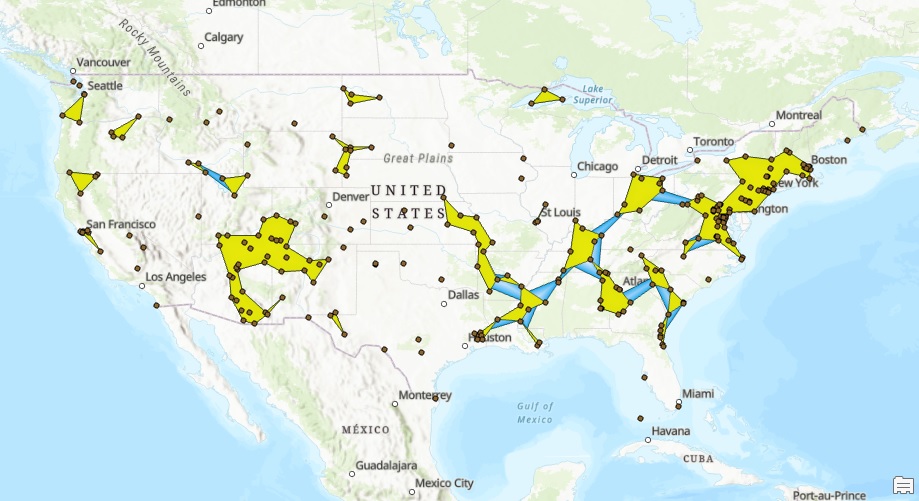
Cluster Points into Polygons with ArcGIS Pro
The latest version of ArcGIS Pro includes a new tool to cluster points into polygons. The resulting polygons can be aggregated into larger polygons using the Aggregate Polygons tool. Introduction This tutorial explains how point data can be aggregated into polygon...