
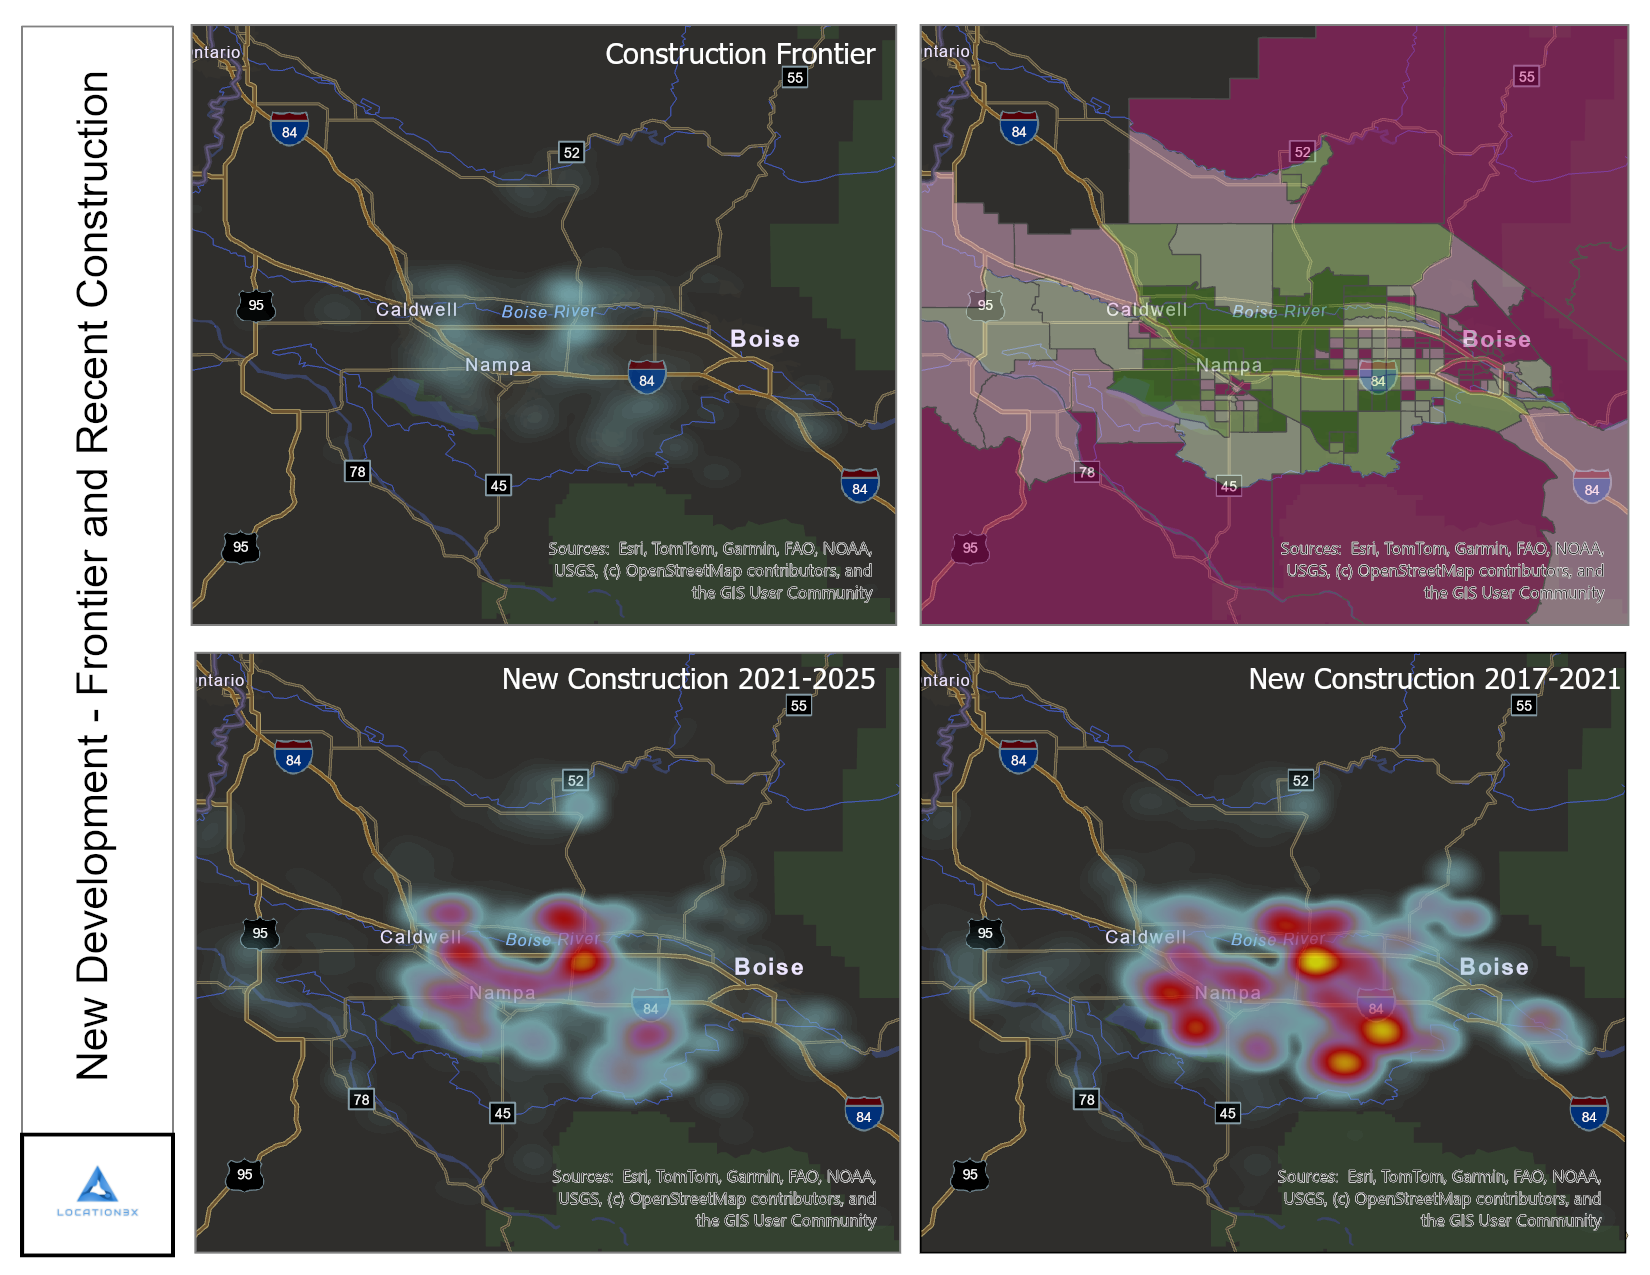
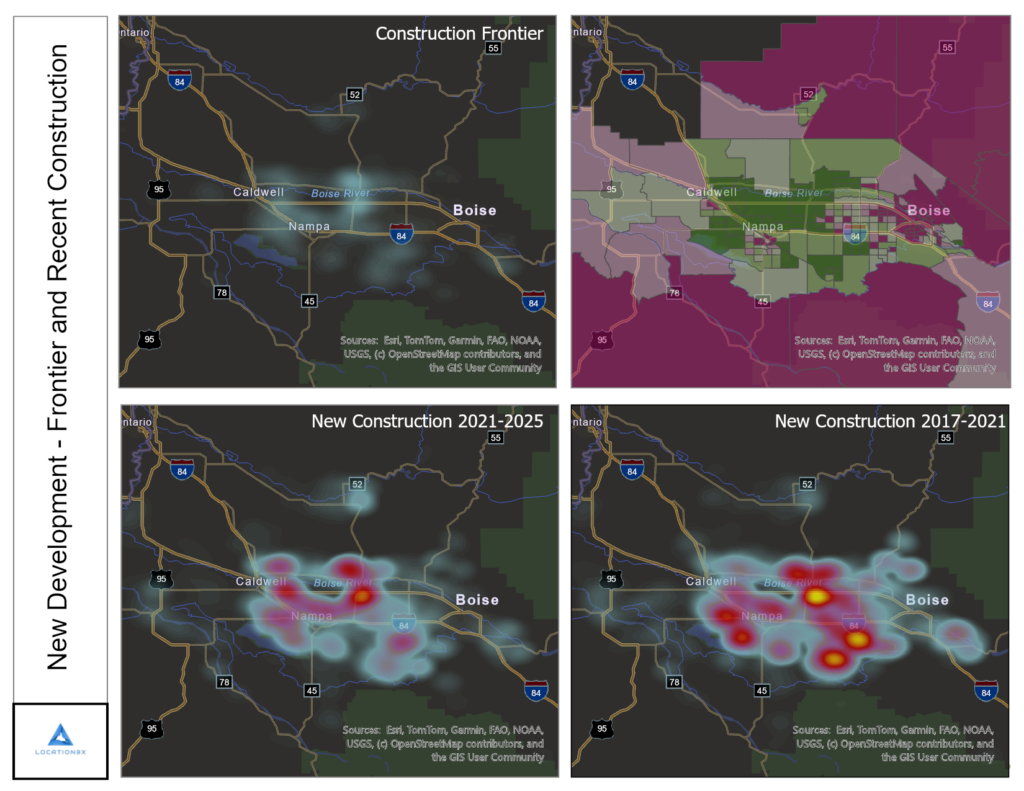
What eight years of satellite-measured land change says about the Treasure Valley
Ask a national headline writer about Boise and you’ll get the 2020–2021 story: pandemic boomtown, California license plates, bidding wars. Ask the land itself and you get something more useful. Every year, the USGS maps every 30-meter square of ground in America and measures how much of it is covered by hard surfaces: rooftops, pavement, concrete. Compare the snapshots and you get a record of exactly where development physically happened, written in the most honest medium there is.
We ran that comparison for the Boise City–Nampa metro across two four-year windows — 2017–2021 and 2021–2025 — and classified every development site by its current building status. Three findings stand out.
1. The metro is still accelerating
Across the five-county metro, 25.0 square miles of land developed between 2021 and 2025, up from 22.6 square miles in 2017–2021** — a 10.7% acceleration, in a period when higher interest rates were supposed to be cooling things off. Whatever happened to demand on paper, the earthmovers didn’t get the memo.
2. The boom front crossed the county line
This is the headline. In the 2017–2021 window, Ada County (Boise, Meridian, Eagle) was the clear center of gravity:
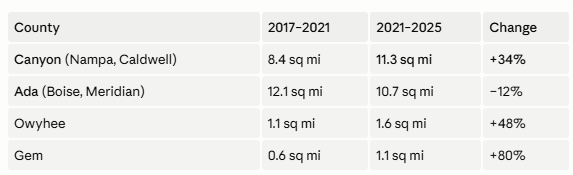
Canyon County now out-develops Ada County. Its share of metro development jumped from 37% to 45% while Ada’s fell from 53% to 43%.

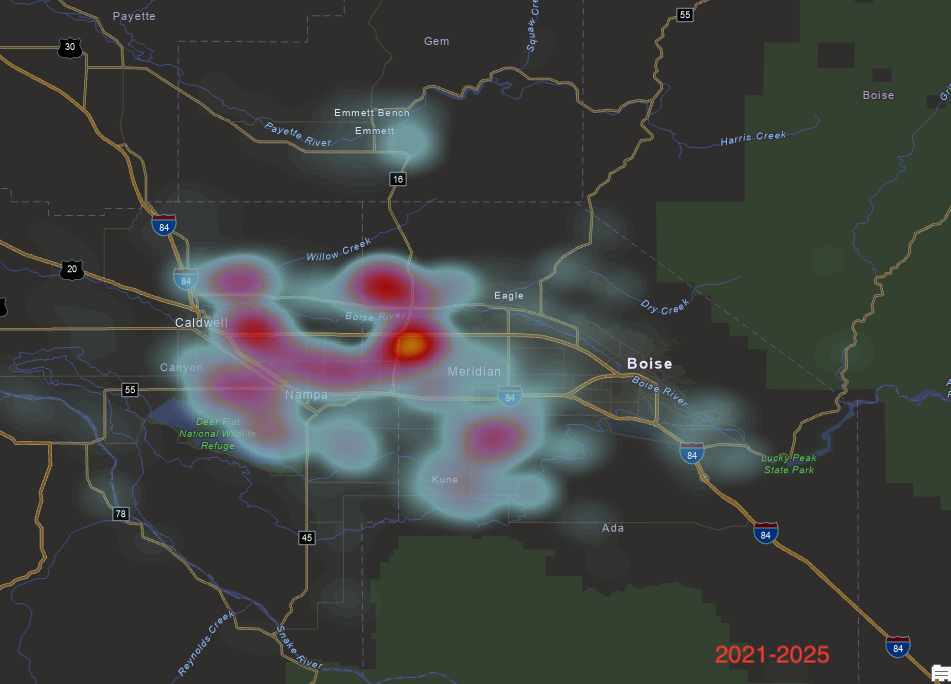
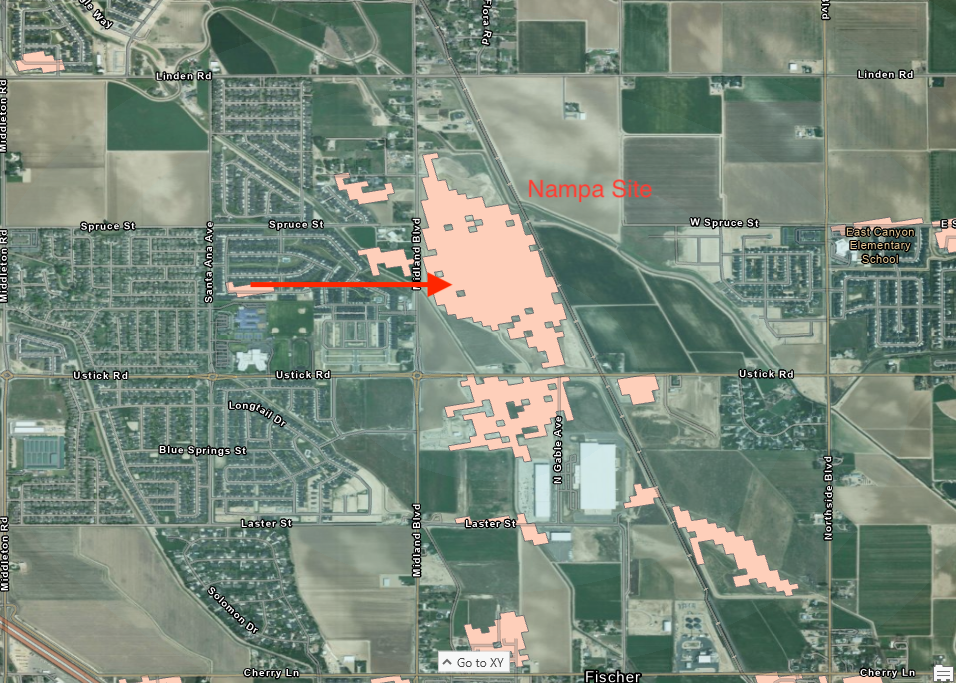
The hottest census tract in the entire metro is on Nampa’s north side — 783 acres developed in four years, more than doubling its prior-window pace, with another 201 acres already graded and waiting. Caldwell’s fastest tract nearly tripled its pace. This isn’t spillover anymore; it’s the main event.
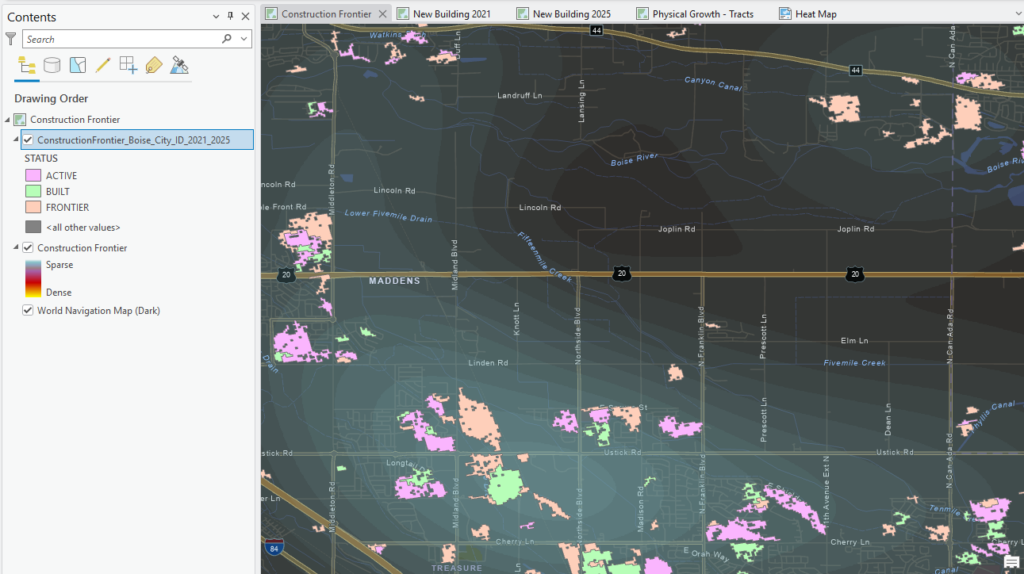
Ada County’s story isn’t decline — it’s displacement. Its growth has pushed to the edges: the Highway 16 corridor in the county’s northwest more than doubled its development pace, and the Kuna area in the south posted some of the metro’s largest gains. The core is filling in; the frontier is at the fringes.
3. The next four years are already graded
Here’s where the physical data does something forecasts can’t: it shows you the pipeline sitting in the dirt.
Classifying every 2021–2025 development site by building presence:
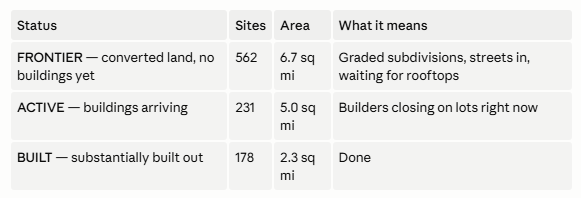
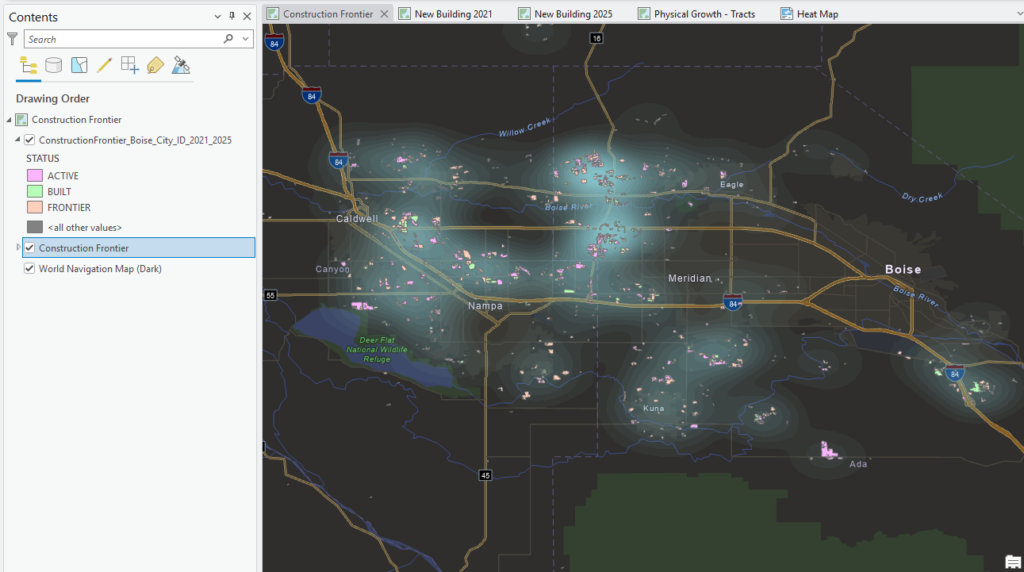
Read that top line again: the Treasure Valley has 6.7 square miles of land that has already been converted to development — streets cut, utilities in — with no buildings on it yet. Add the 5.0 square miles actively building and the metro is carrying roughly half a four-year window’s worth of future construction as standing inventory. Frontier land outweighs built-out land almost three to one, which is what the early innings of an expansion look like — not the late ones.
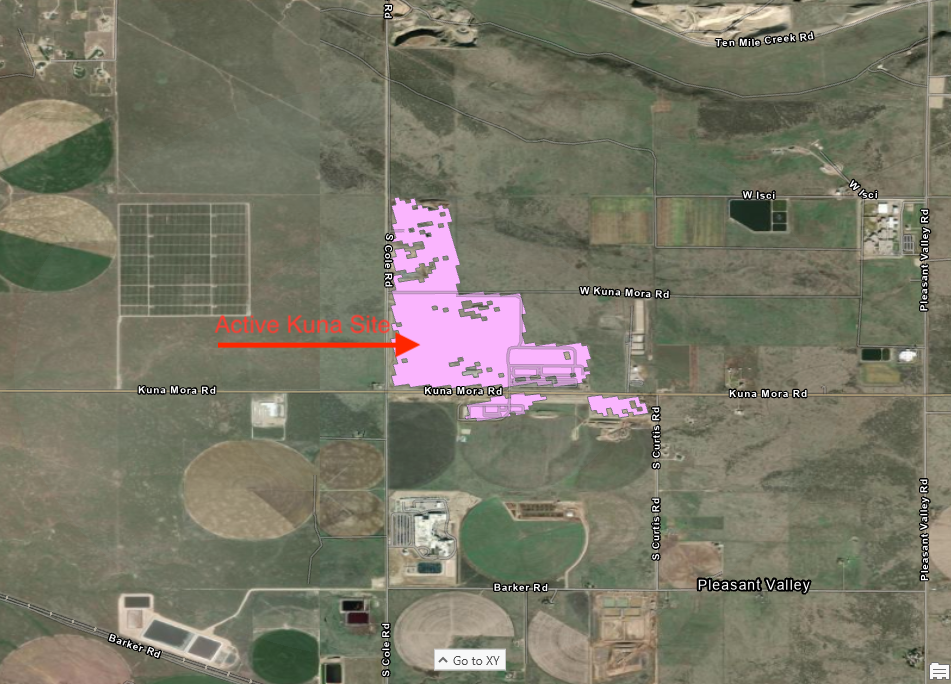
And the frontier is not evenly spread. The largest graded-and-waiting sites cluster in exactly the places finding #2 predicts: north Nampa (79 acres, the metro’s largest), Caldwell, south Nampa, and the Kuna–south Meridian belt. The single largest *active* site is a 225-acre campus south of Kuna with only a handful of structures so far — scale that says data center or industrial campus, not cul-de-sacs, and a reminder that the next phase of Treasure Valley growth includes employers, not just rooftops.
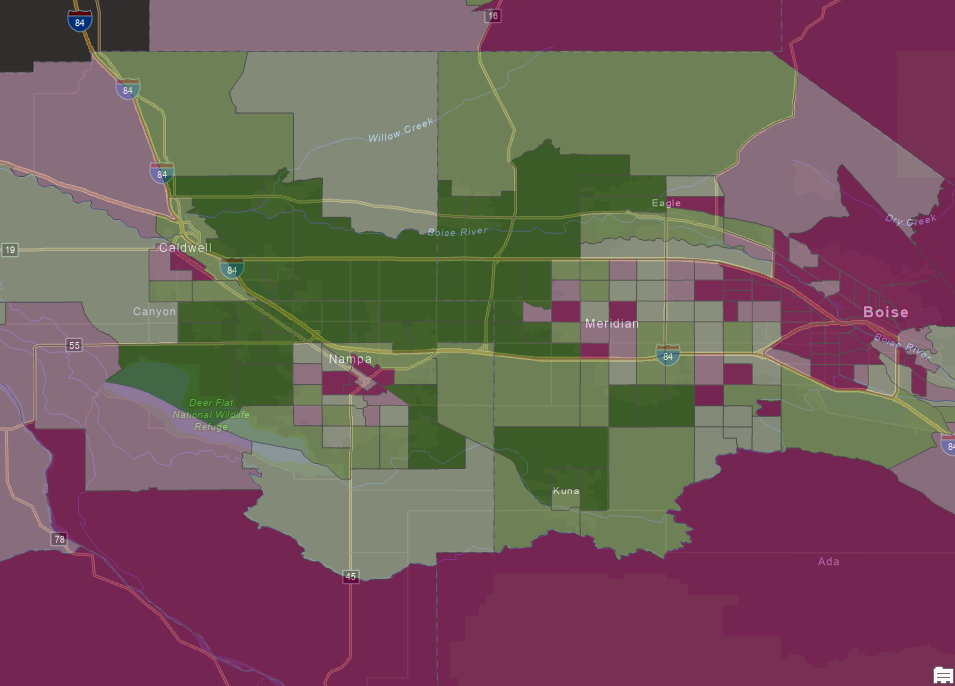
Development intensity by census tract. Green = more concentrated development intensity
What to watch
- The Nampa–Caldwell corridor is the metro’s growth engine now. If you’re underwriting retail, services, or housing follow-on demand, that’s where the population is physically arriving next.
- Highway 16 is quietly becoming Ada County’s next front — watch the frontier acreage there convert to ACTIVE over the next refresh.
- The frontier backlog is the leading indicator. Six-plus square miles of graded land doesn’t sit idle in a metro with this trajectory; the interesting question is how fast it flips to ACTIVE, and the next data refresh will answer it.
A note on what this data is — and isn’t
These numbers measure *hard surfaces*, observed by satellite. They don’t rely on permits, announcements, or anyone’s forecast — which is their strength. Two limits: freshly graded dirt doesn’t register until pavement goes down, so sites mid-grading are undercounted; and building inventories lag reality by a year or so, meaning some “frontier” land already has framing on it. Both cut the same direction — if anything, the numbers above *understate* how much is happening.
—
*This analysis comes from Ground Pulse, Location3x’s satellite-measured development dataset — per-metro GIS layers and reports covering impervious-surface change, new construction, and the Construction Frontier. Boise is one of 198 metros in the library.
*Data: USGS Annual NLCD (Collection 1.2). Building data © Overture Maps Foundation, © OpenStreetMap contributors, Microsoft — ODbL.
