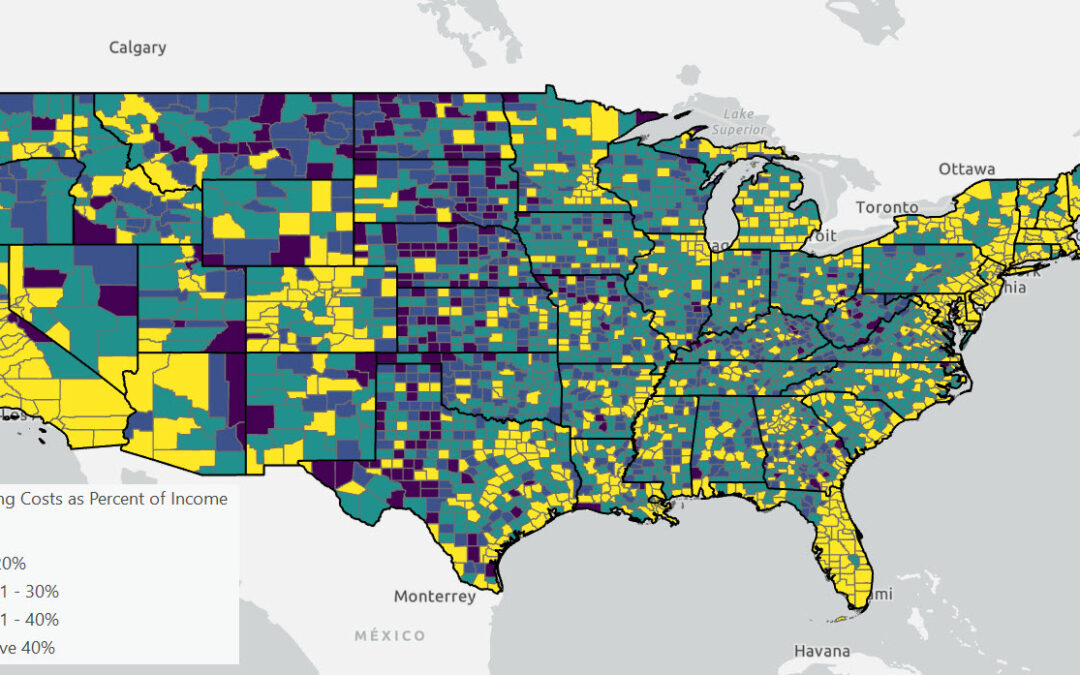
From Bad to Worse: The Escalating Cost Burden on American Renters
In 2022, according to the latest U.S. Census Bureau data, 44% of American renters allocated 30% or more of their income to housing costs, with 23% spending at least half of their income on housing. This level of expenditure classifies them as “cost...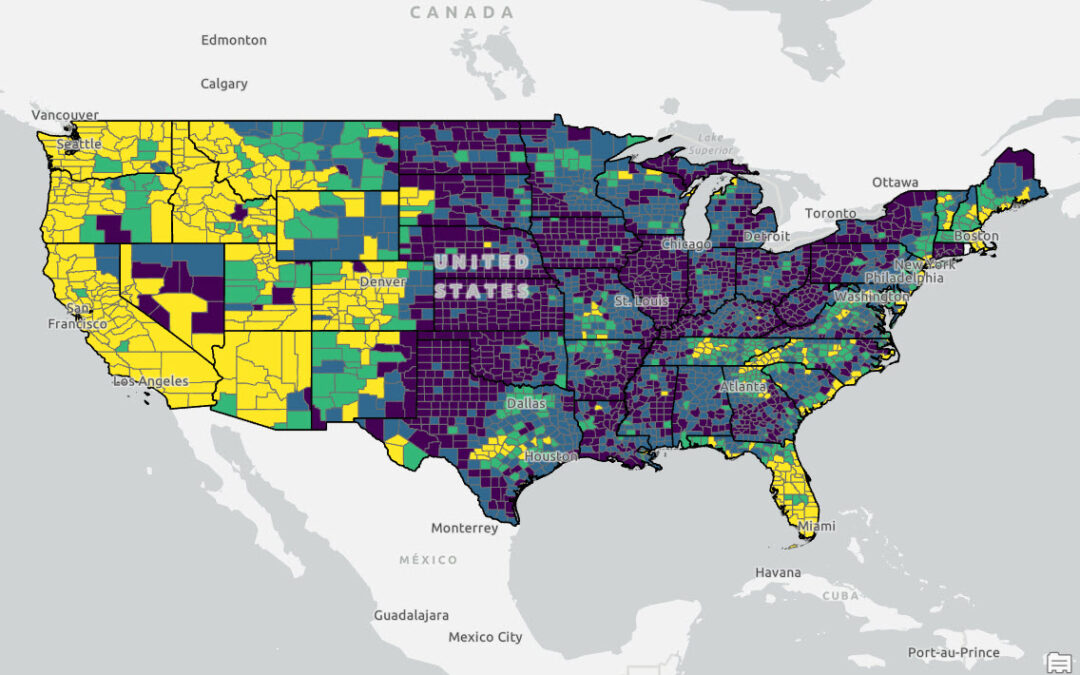
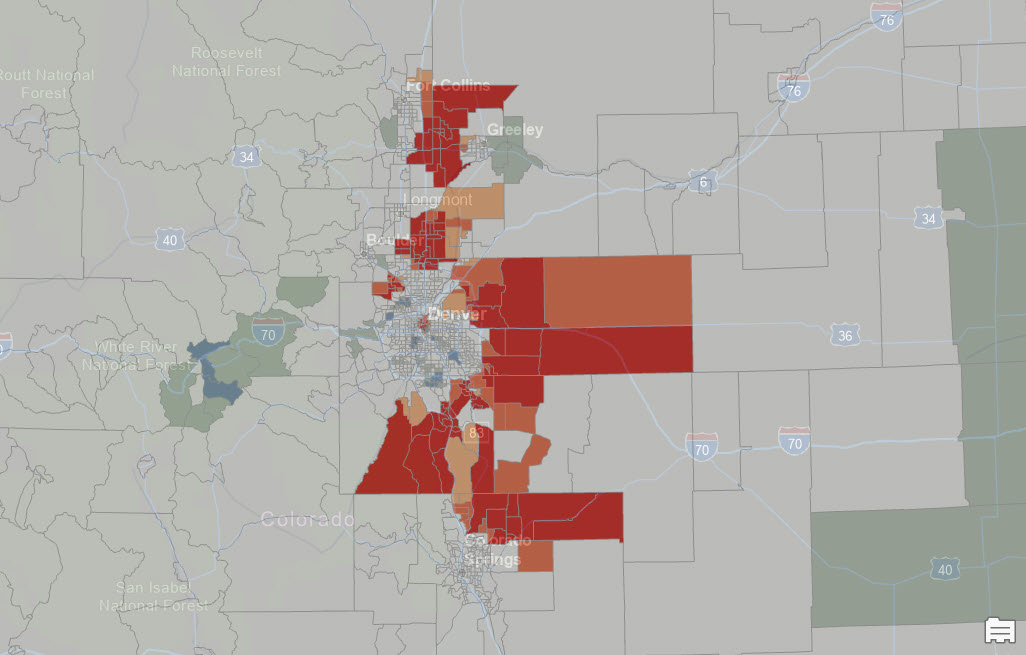
Mapping the US Housing Affordability Gap: Simple Techniques with ArcGIS Pro, R, and AI
This article explores the significant disparities in housing affordability between the coastal regions of the United States and the Midwest. Here we present an R script that merges 2022 county-level median income data with the Zillow Home Value Index (ZHVI), a...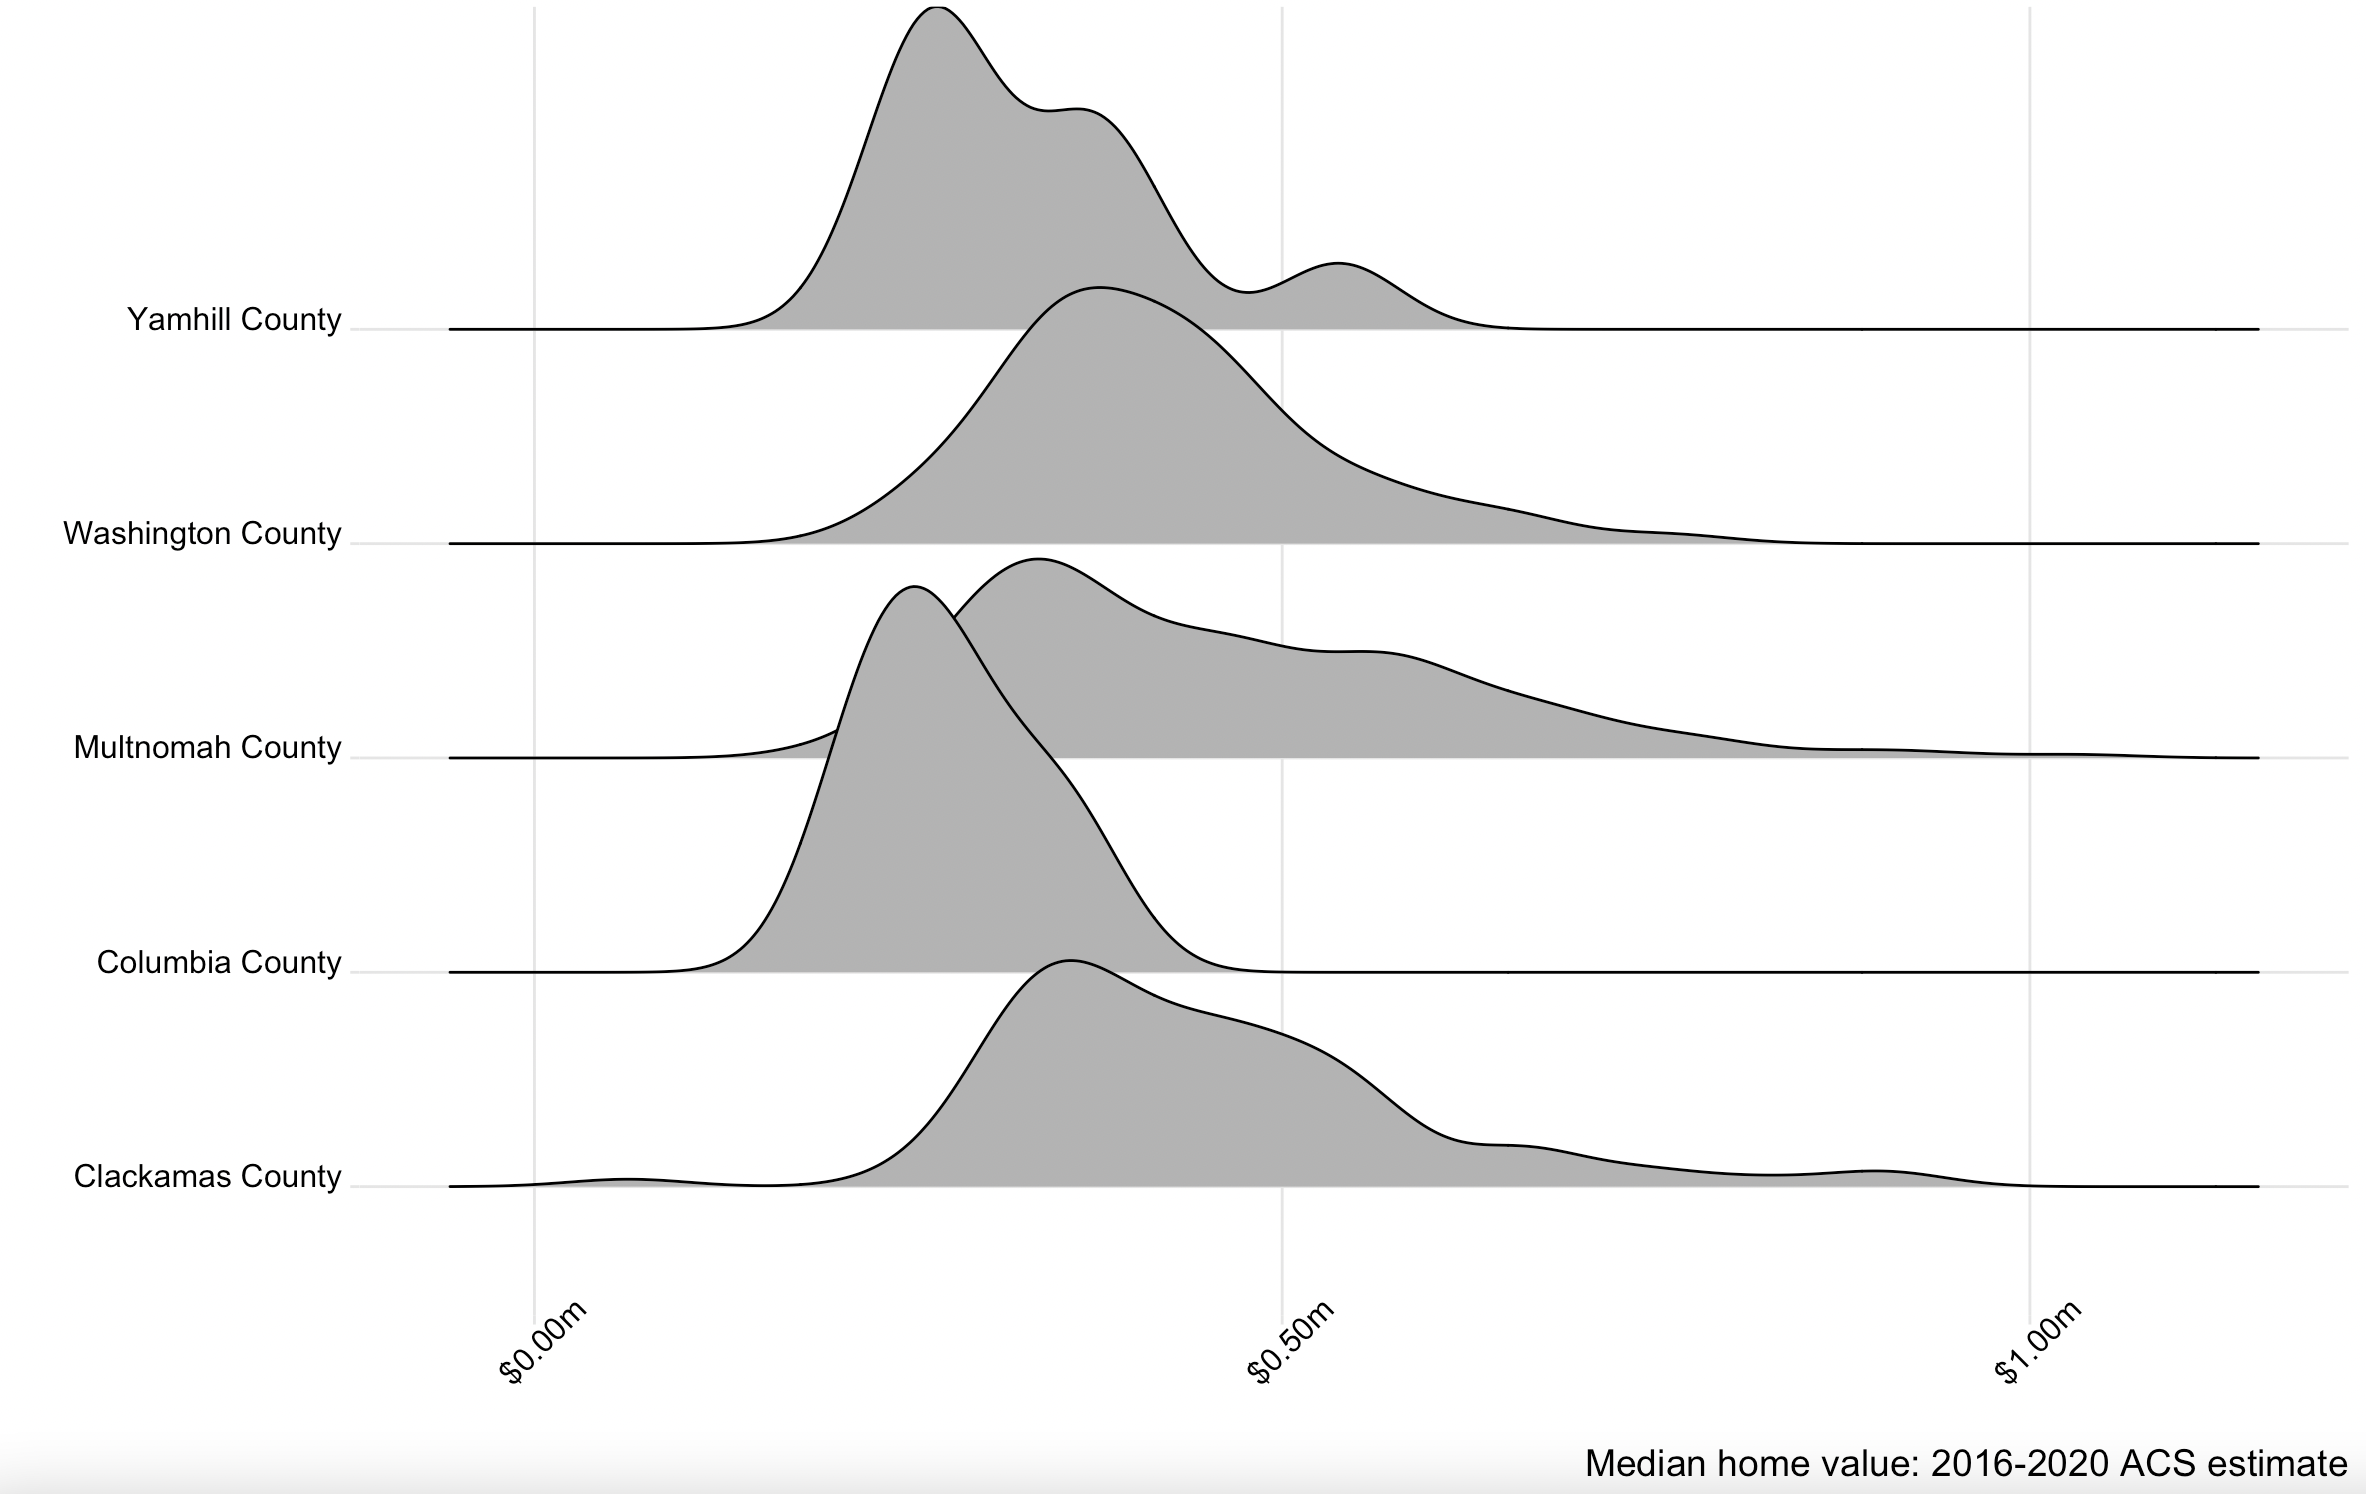
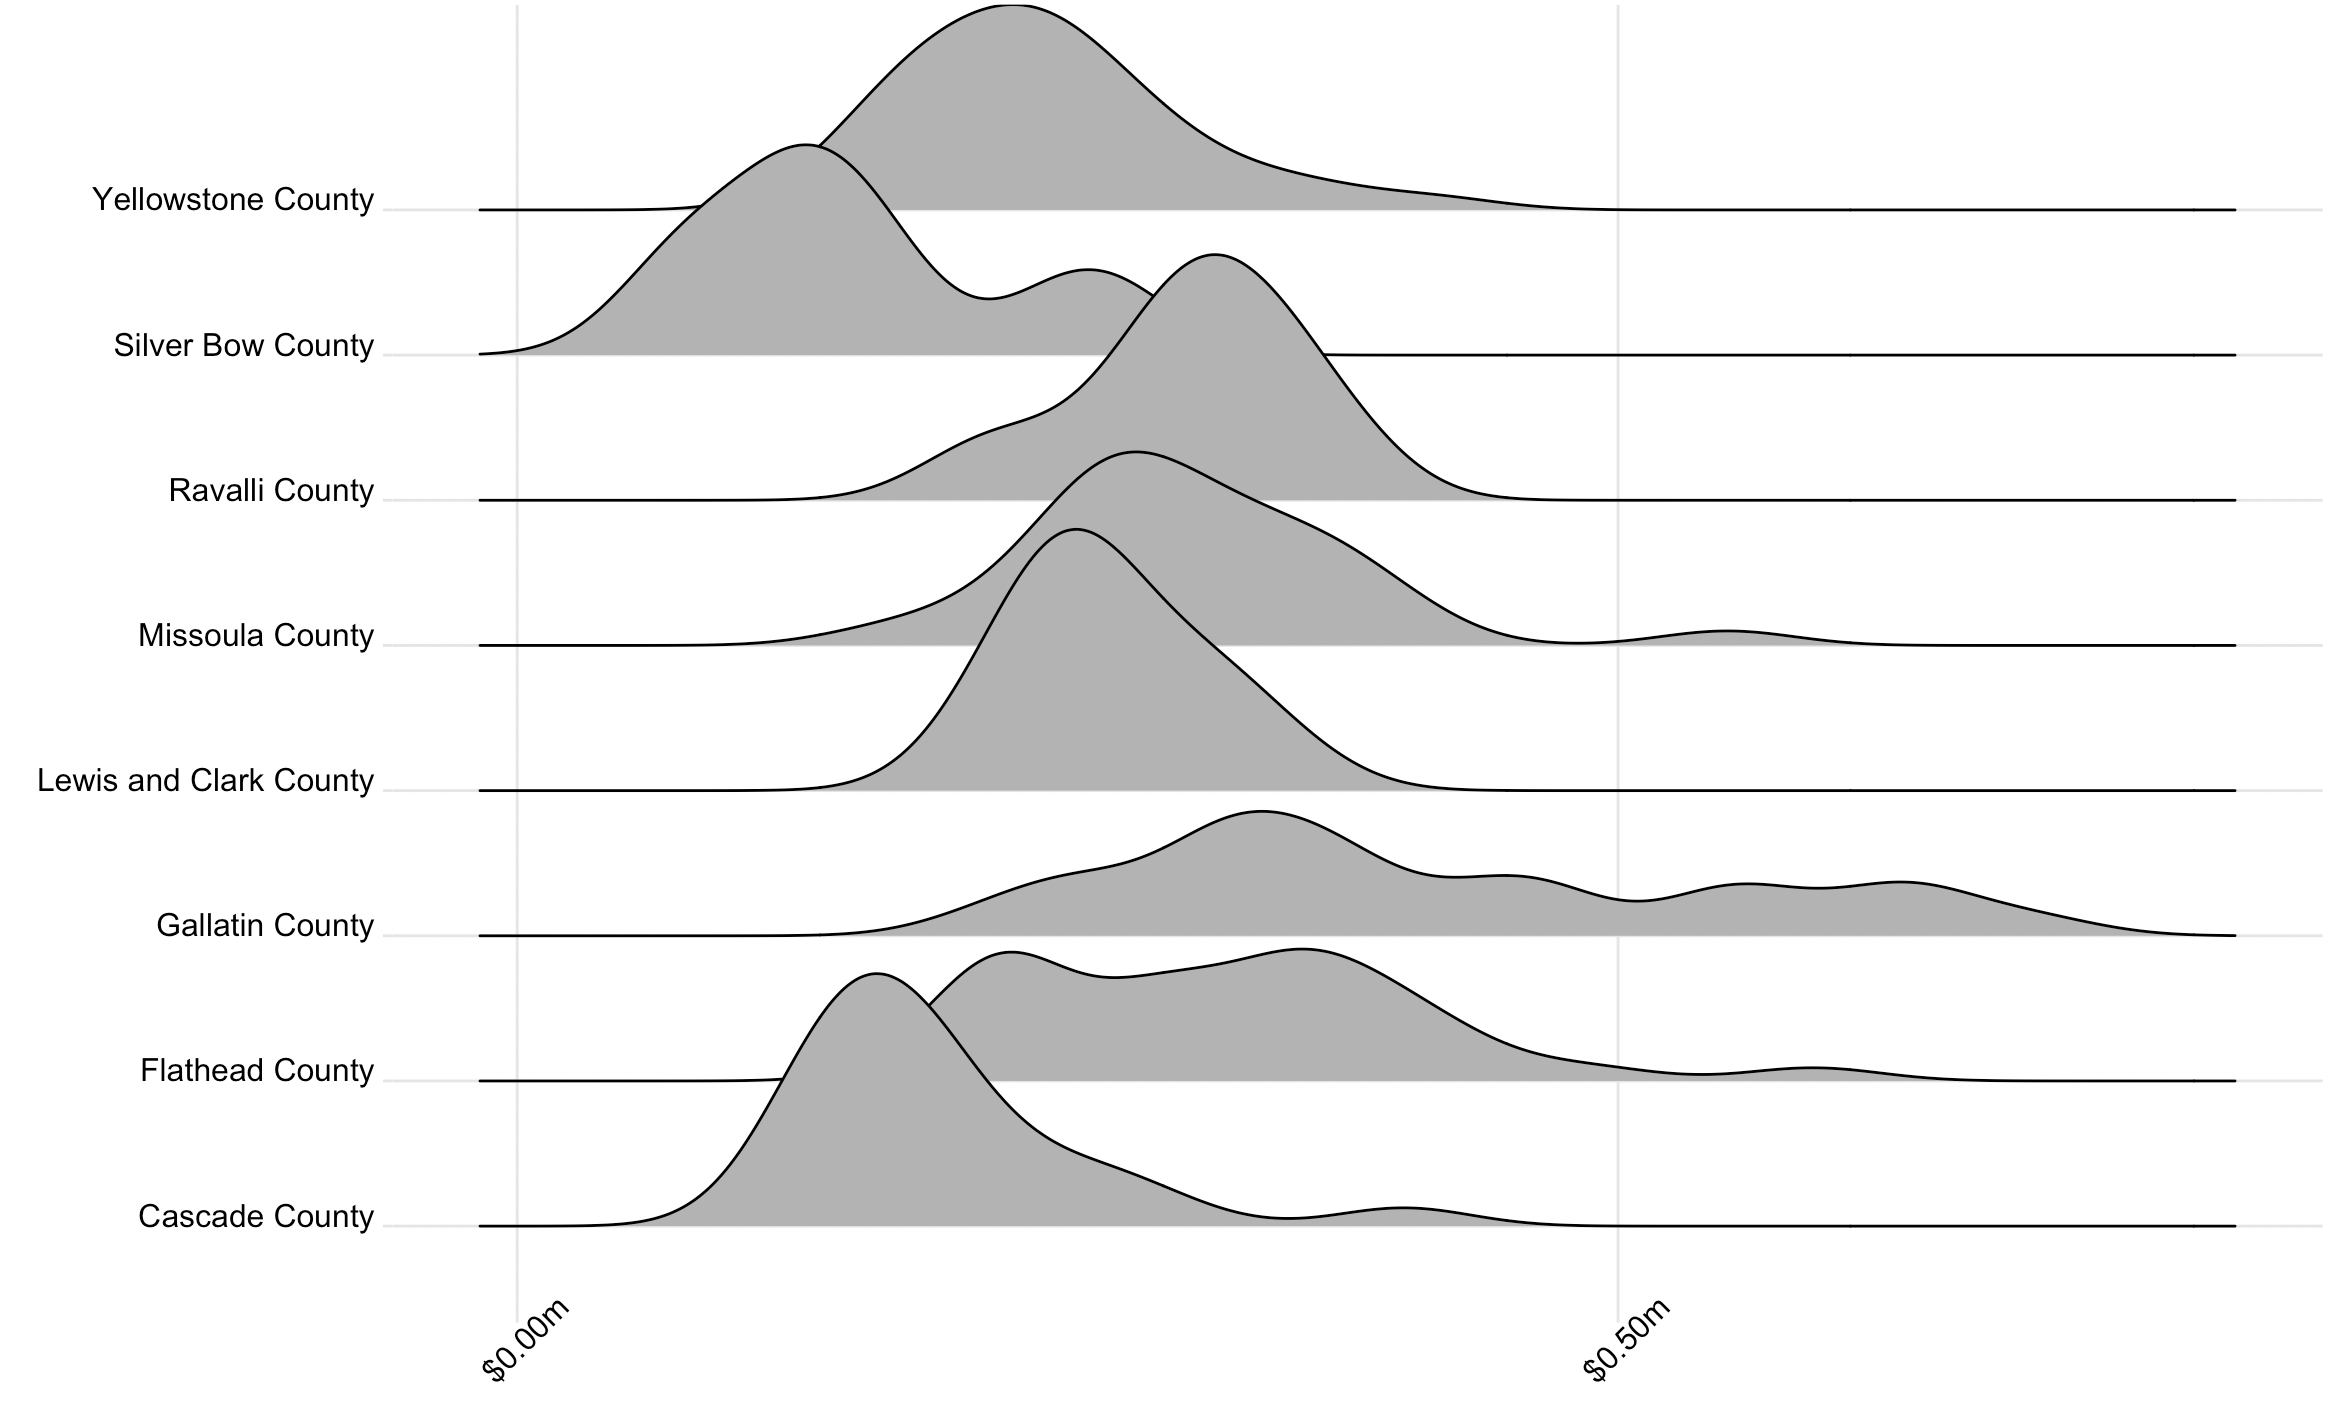
Visualizing Portland Area Home Values with R
Many of our readers regularly work with U.S. Census data for mapping and analysis purposes. Whether you work with these datasets every day or just every now and then to create a map or graph you’ve no doubt discovered how difficult it can be to decipher census table...
Visualizing Raleigh-Durham Area Home Values with R
Many of our readers regularly work with U.S. Census data for mapping and analysis purposes. Whether you work with these datasets every day or just every now and then to create a map or graph you’ve no doubt discovered how difficult it can be to decipher census table...