

Over the last five years, the western United States has experienced notable shifts in population patterns, with distinct regions emerging as either growth hot spots or cold spots. Cities like Denver, Colorado, and Boise, Idaho, have seen substantial population increases, driven by their robust economies, outdoor lifestyles, and relative affordability compared to coastal metropolises. Conversely, areas such as rural Nevada and parts of New Mexico have encountered slower growth or population declines, often due to limited economic opportunities and an aging population. This blog post will highlight the regions experiencing booming growth and those facing demographic challenges, offering insights into the evolving population trends in the western United States.
Study Methods
To accurately identify the population growth hot spots and cold spots in the western United States, we utilized the R tidycensus package, which allows for seamless access to American Community Survey (ACS) data. Specifically, we analyzed population data from the years 2017 and 2022 to capture changes over the five-year period and then used the ArcGIS Pro Hot Spots Analysis tool to determine population growth hot and cold spots at a census tract level for the Western United States.
The interpolate_pw() function from the tidycensus package played a crucial role in this analysis. This function, found in the tidycensus package, is designed for small area interpolation of population data. This function is particularly useful when working with demographic data from the American Community Survey (ACS) across different time periods at the census tract level. The interpolate_pw() function performs piecewise linear interpolation, which estimates population values for intermediate years by connecting data points from different years with straight-line segments. This method is essential for creating smooth, continuous population estimates over time, especially in small geographic areas where population changes can be more volatile and granular data is needed.
Using interpolate_pw() is advantageous for small area interpolation because it allows for:
1. Accurate Trend Analysis: By interpolating data between two points, researchers can observe population trends more accurately within smaller geographic areas, such as census tracts.
2. Granular Insights: It provides detailed insights into population dynamics that may be missed when only looking at larger geographic units or longer time intervals.
3. Data Continuity: Ensures continuity of data, which is crucial for longitudinal studies and for understanding demographic changes over time.
Overall, the interpolate_pw() function is a powerful tool for demographers and researchers looking to analyze population changes with high spatial and temporal resolution.
The R script below (you can download the script here) pulls US Census Data for population from the year 2017 and 2022 at the census tract level (figure 1 below) along with census block data (figure 2 below). The interpolate_pw() function is then executed using these datasets to produce a new interpolated data frame of population change and the results are written to a shapefile (figure 3 below).
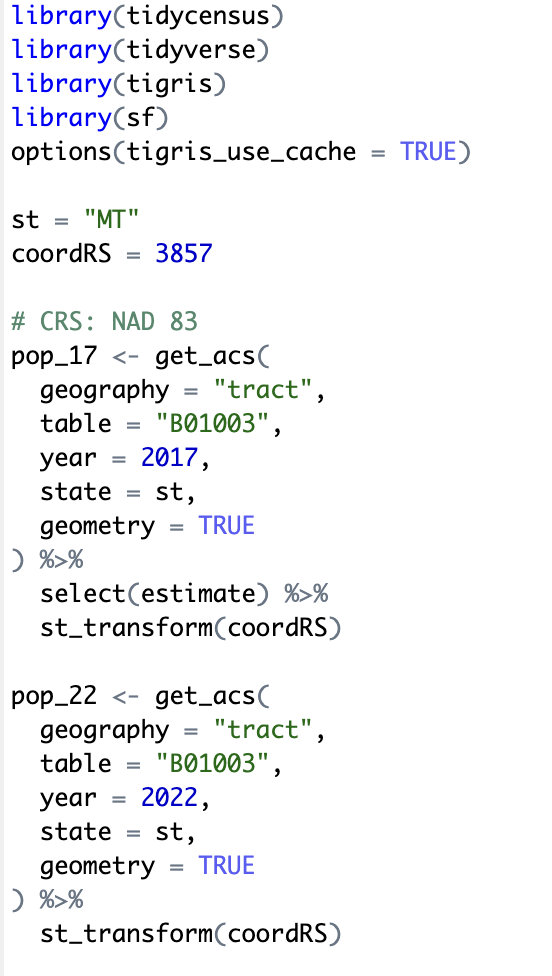
Figure 1
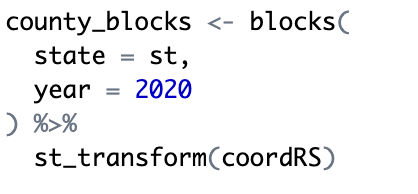
Figure 2
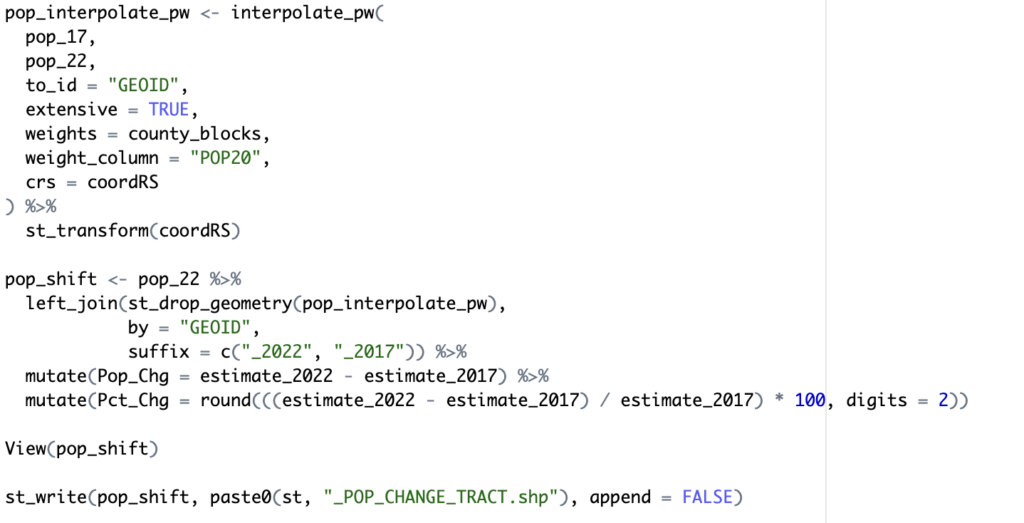
Figure 3
Output Maps
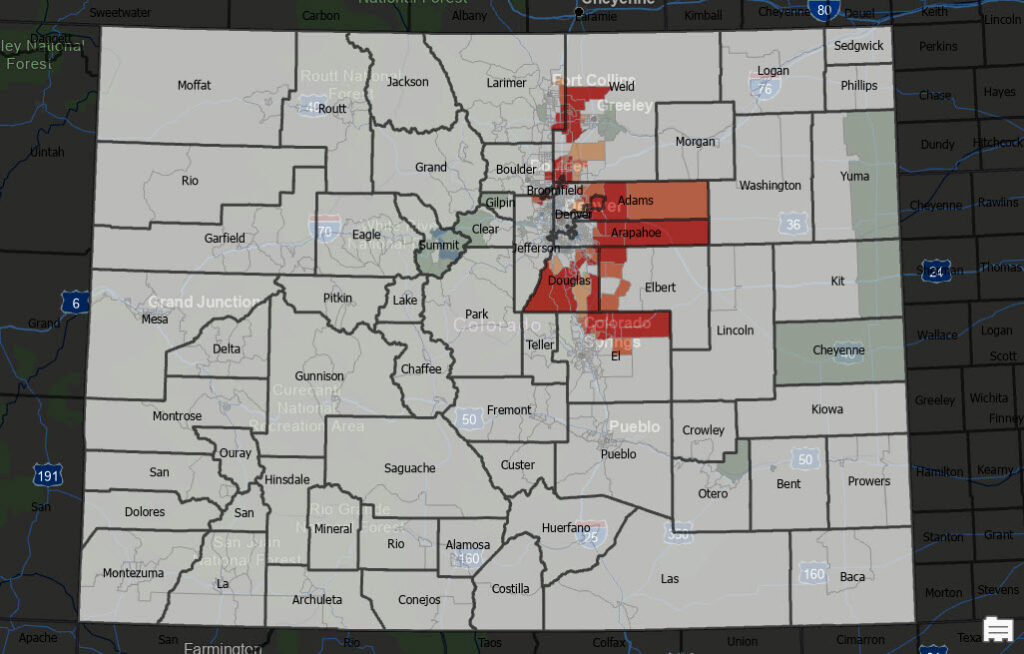
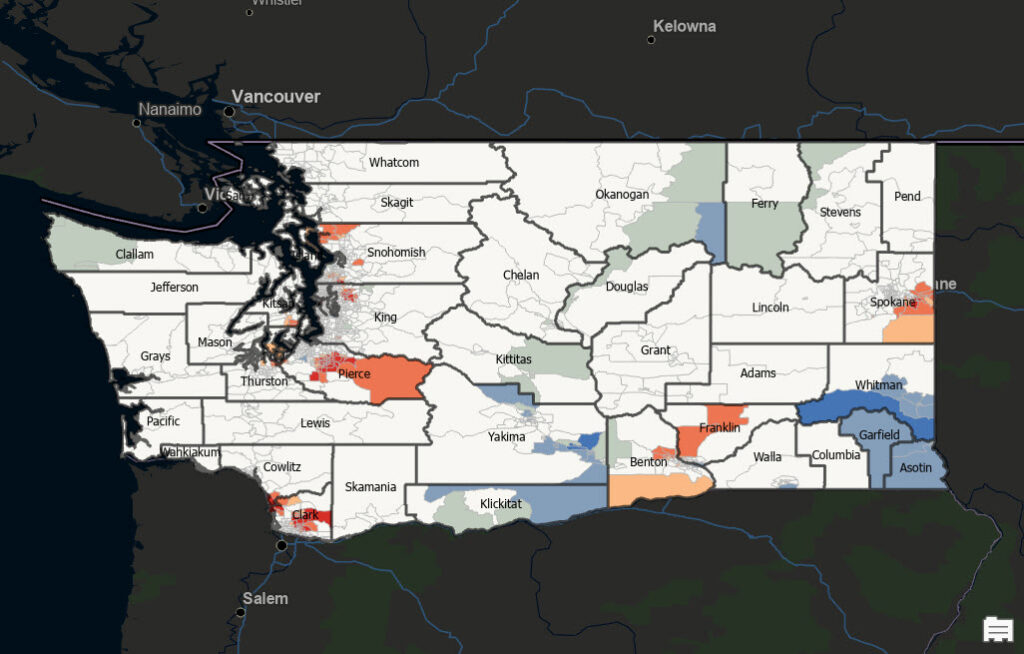
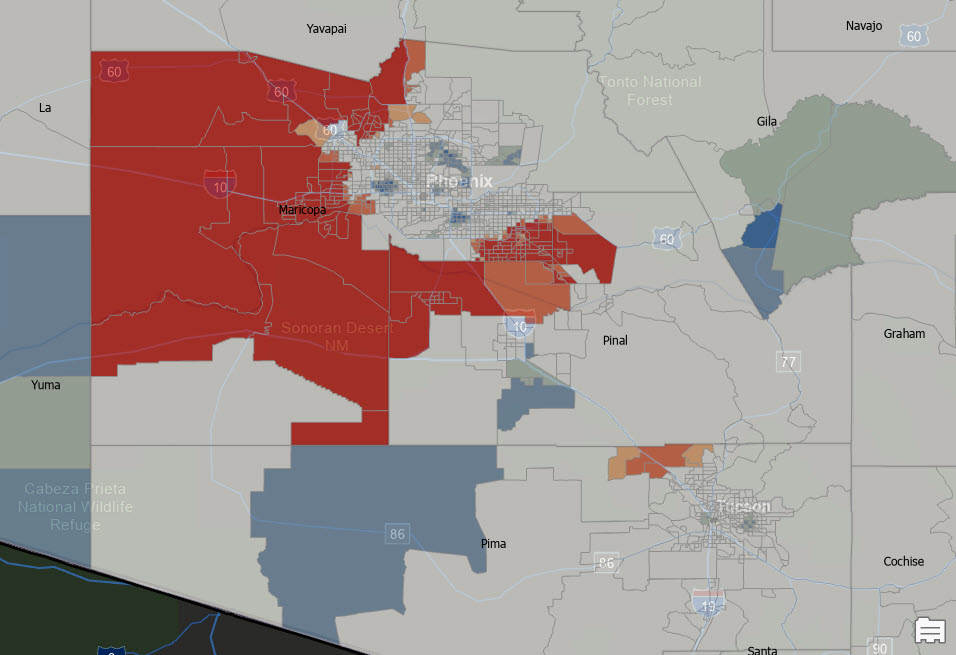
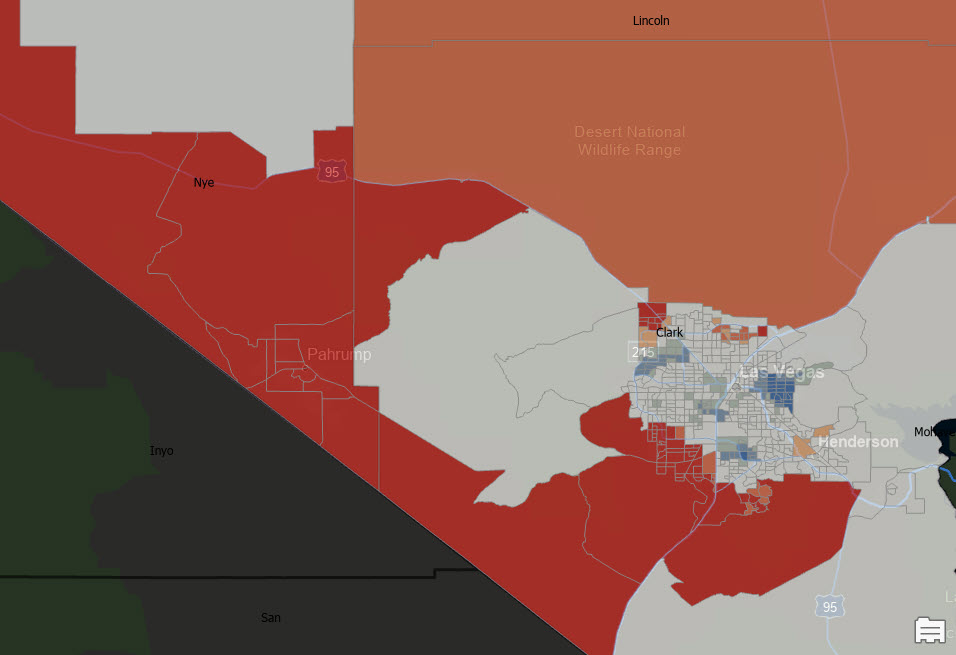
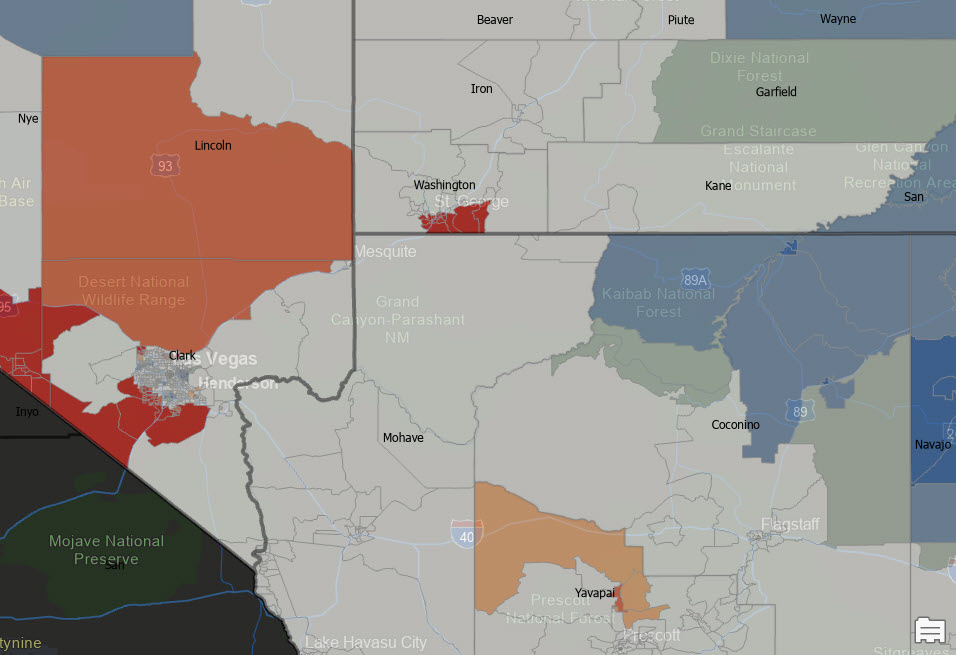
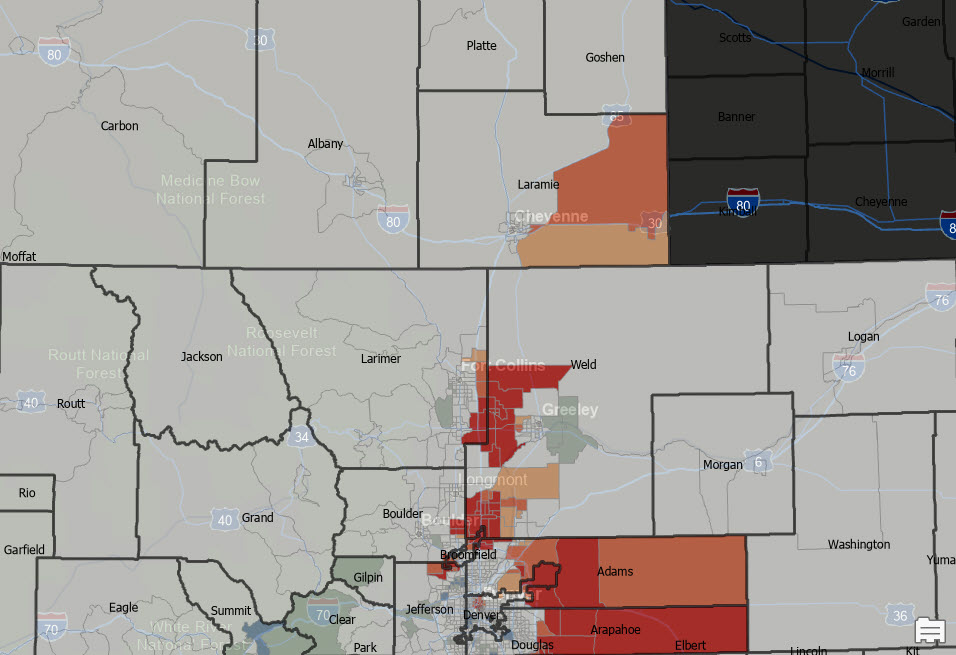
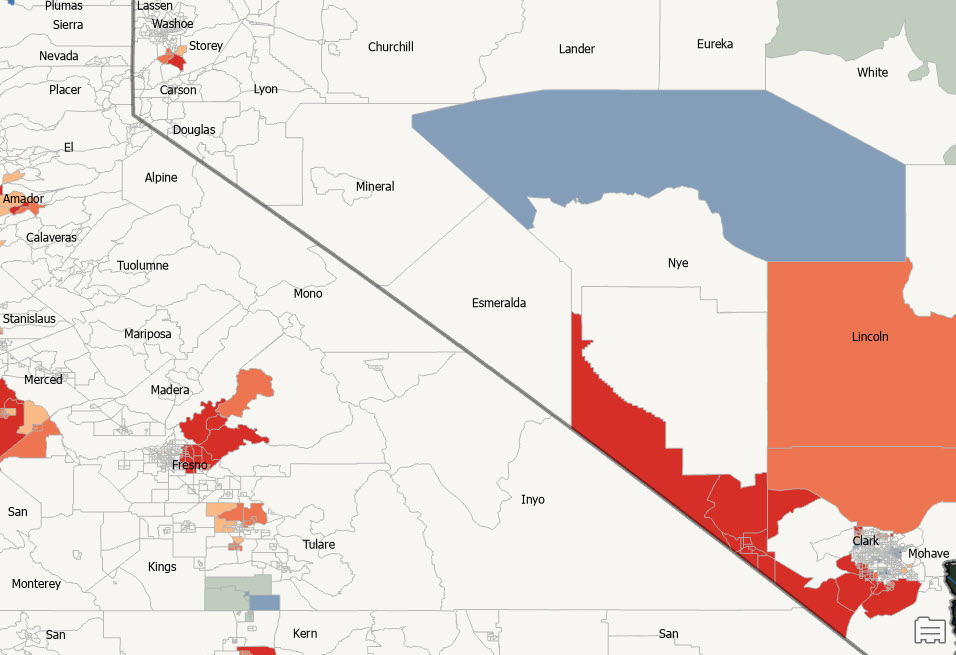
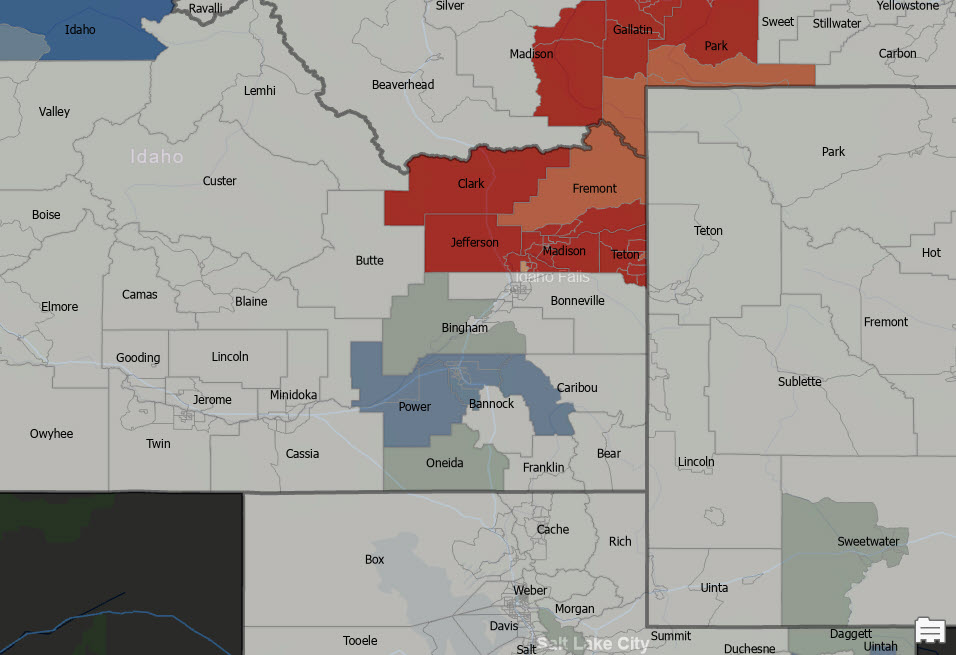
The output shapefile was then imported into ArcGIS Pro and the Hot Spot Analysis (Getis-Ord Gi*) geoprocessing tool was run using the Pop_Chg field with a K nearest neighbors (18 neighbors) spatial relationship to produce maps similar to what you see in the screenshot below for the Denver, CO metropolitan area.
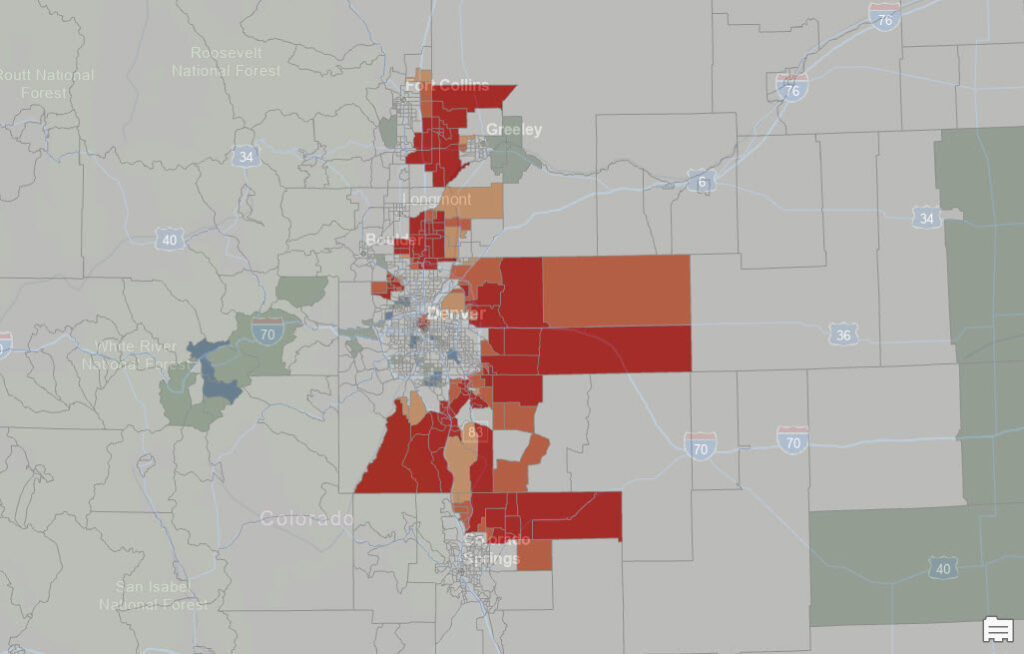
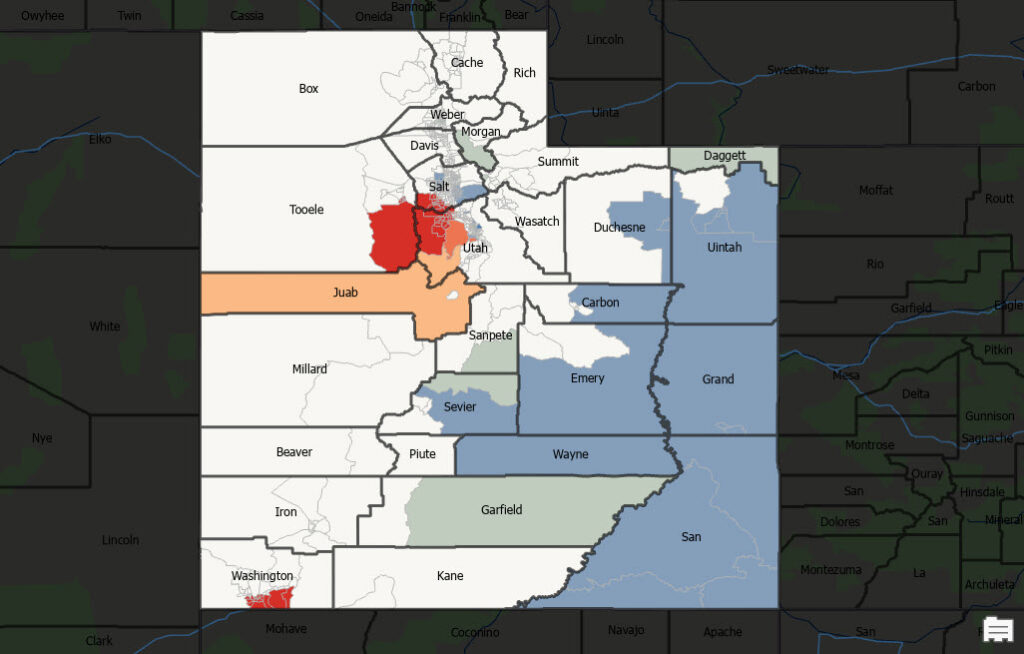
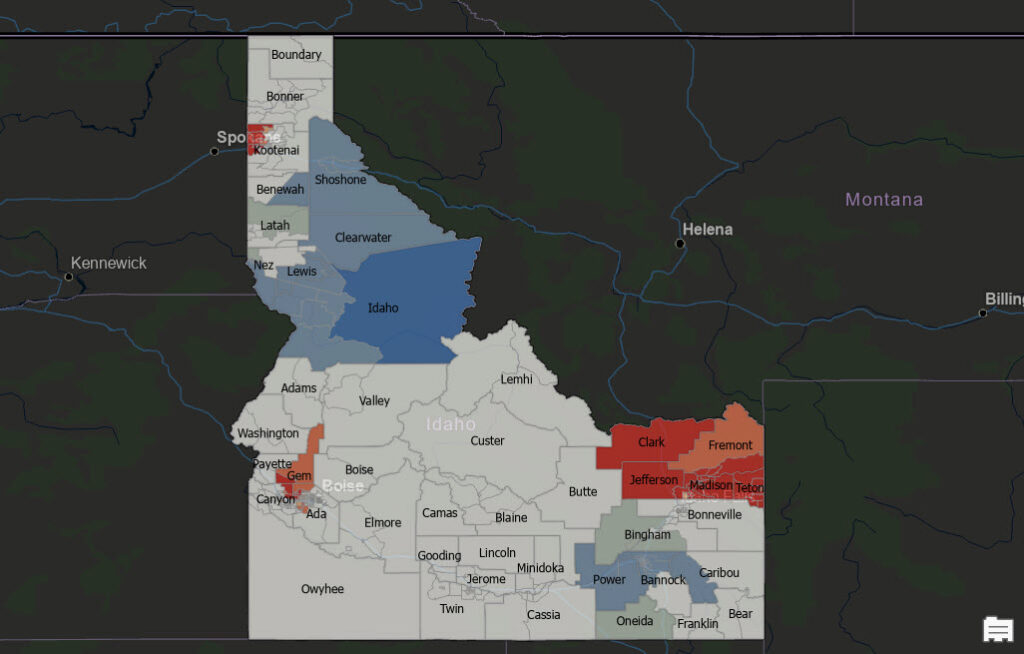
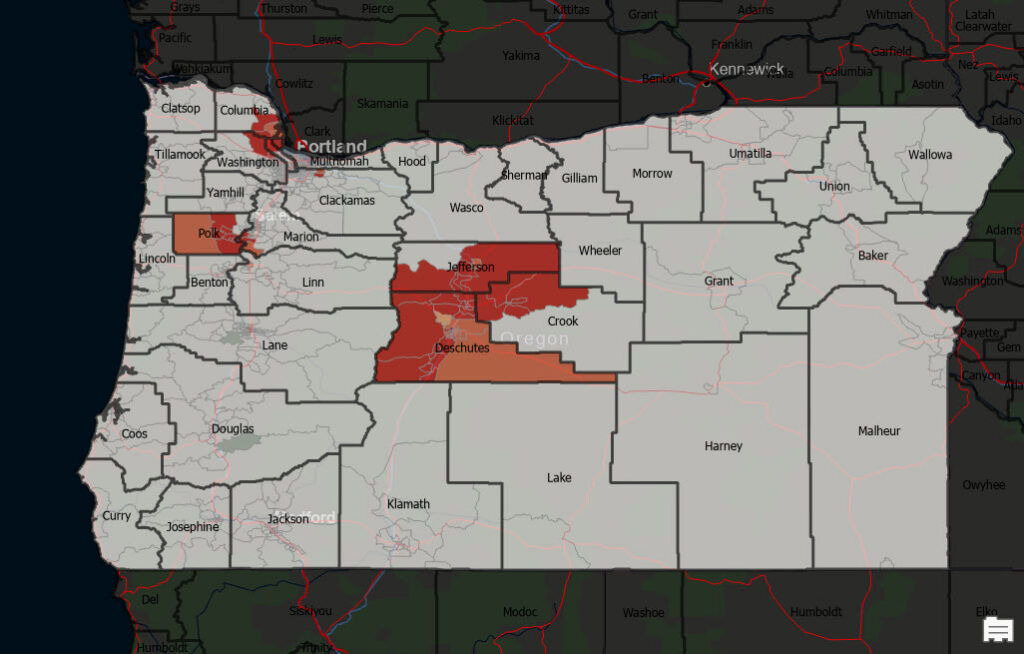
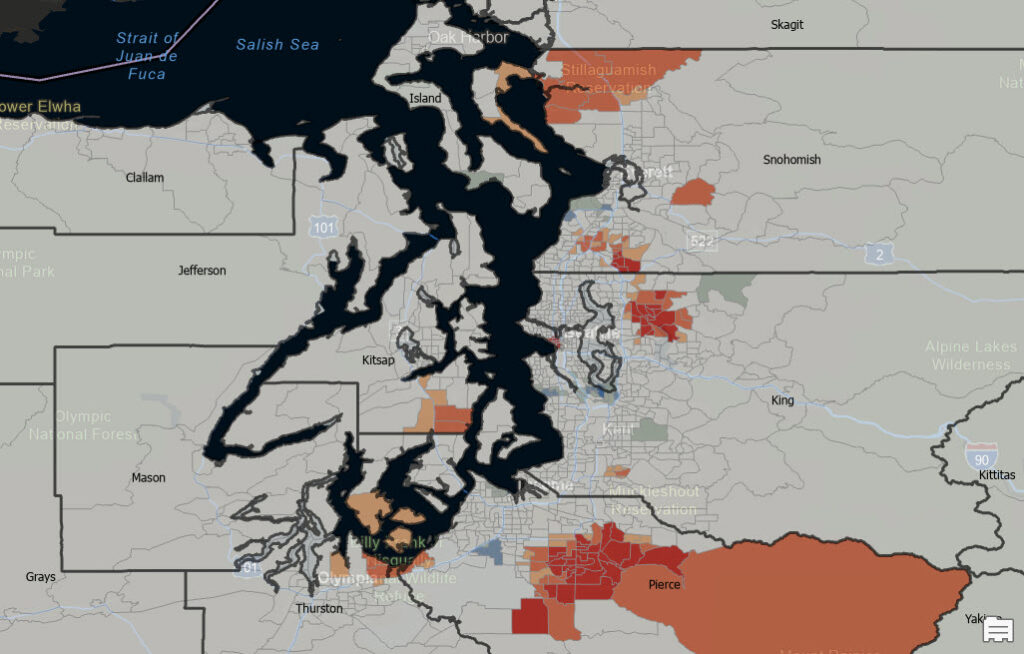
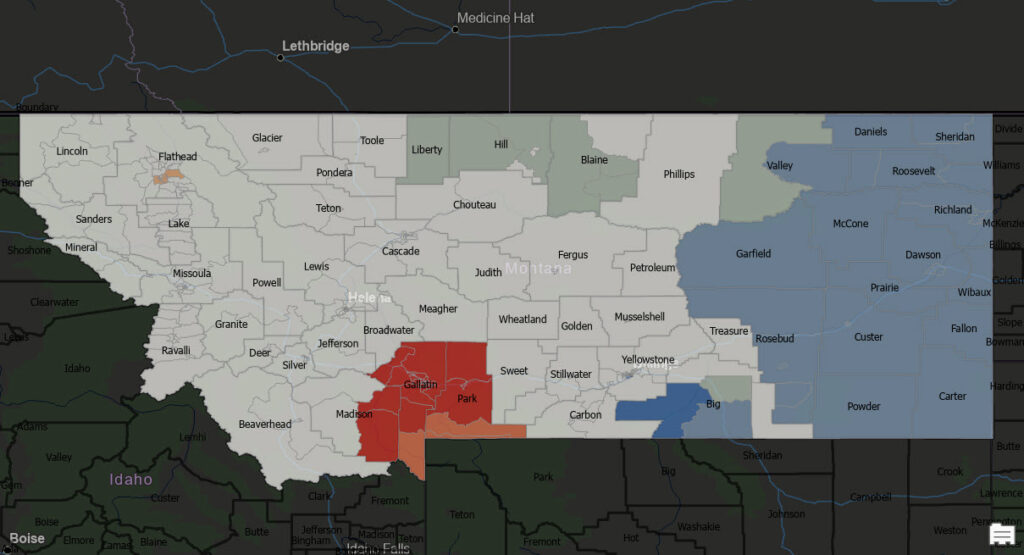
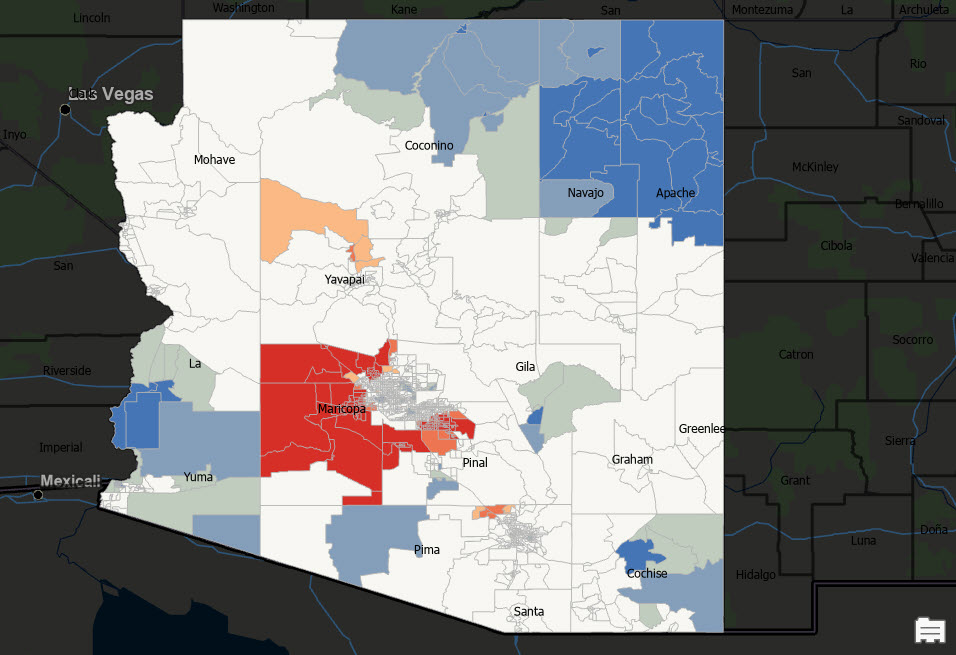
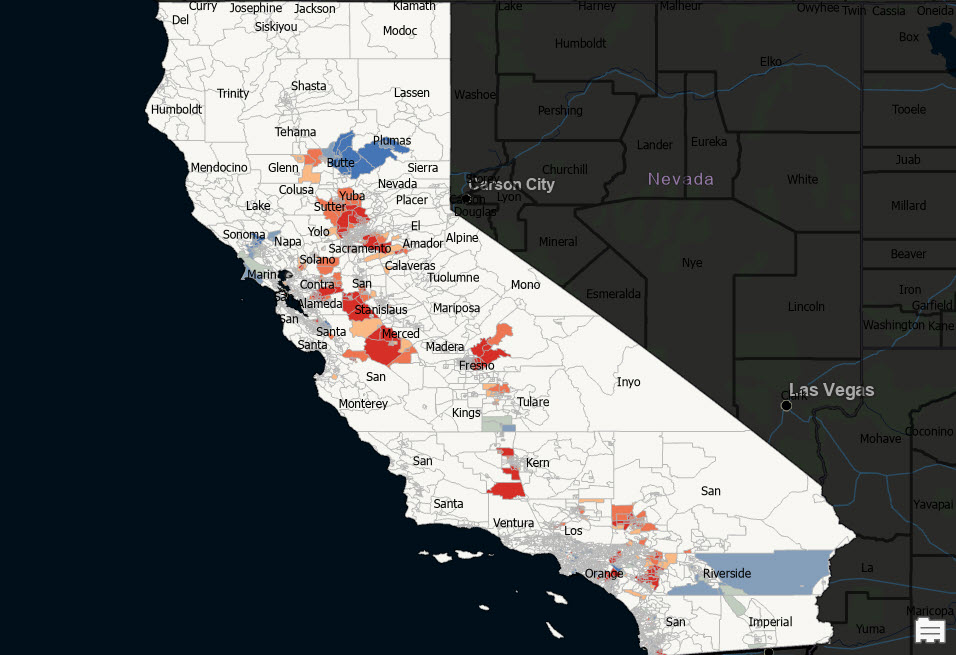
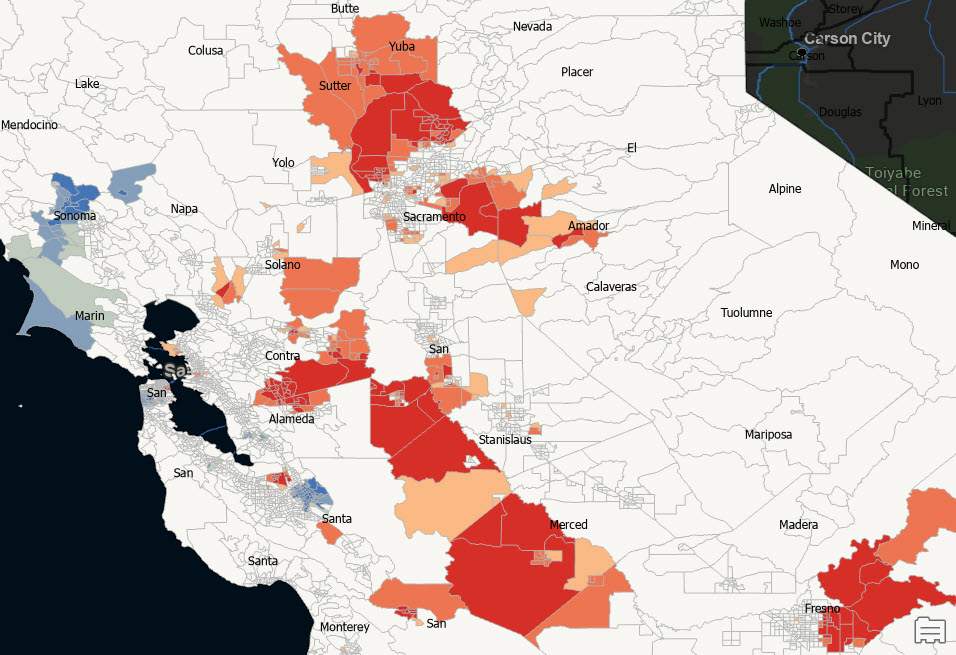
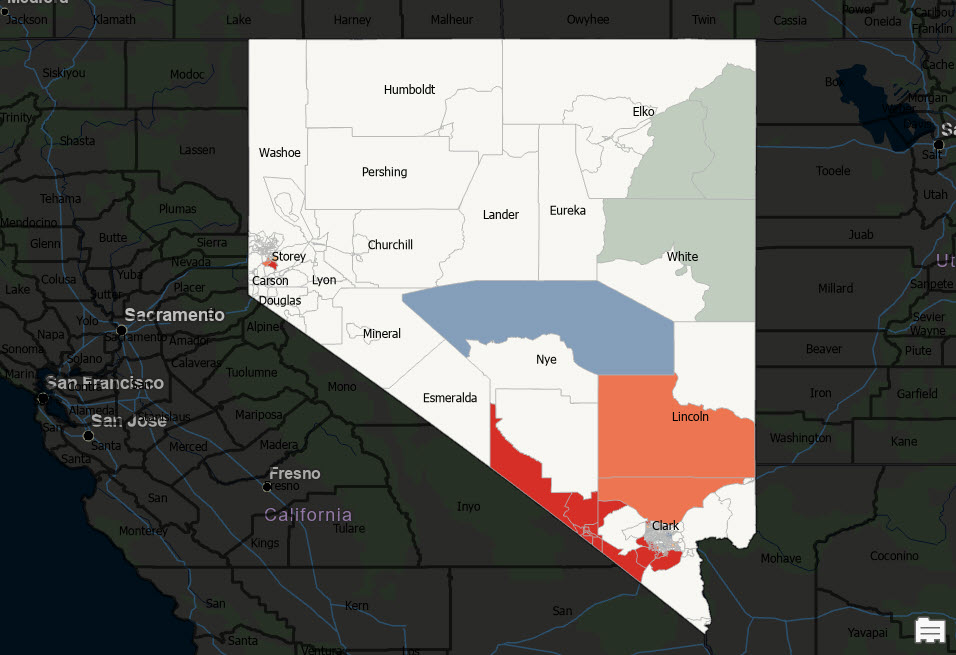
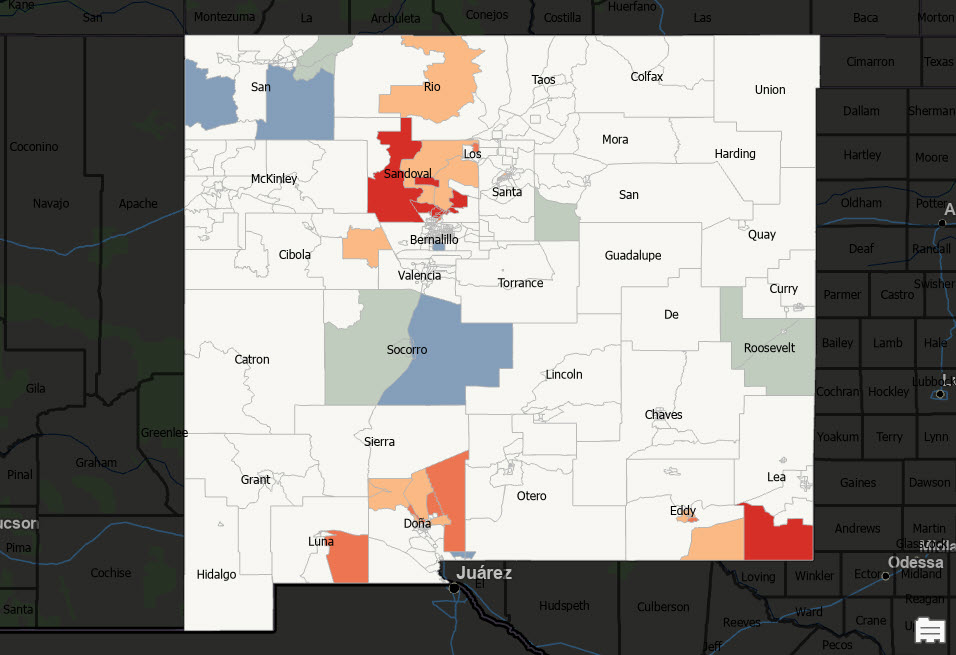
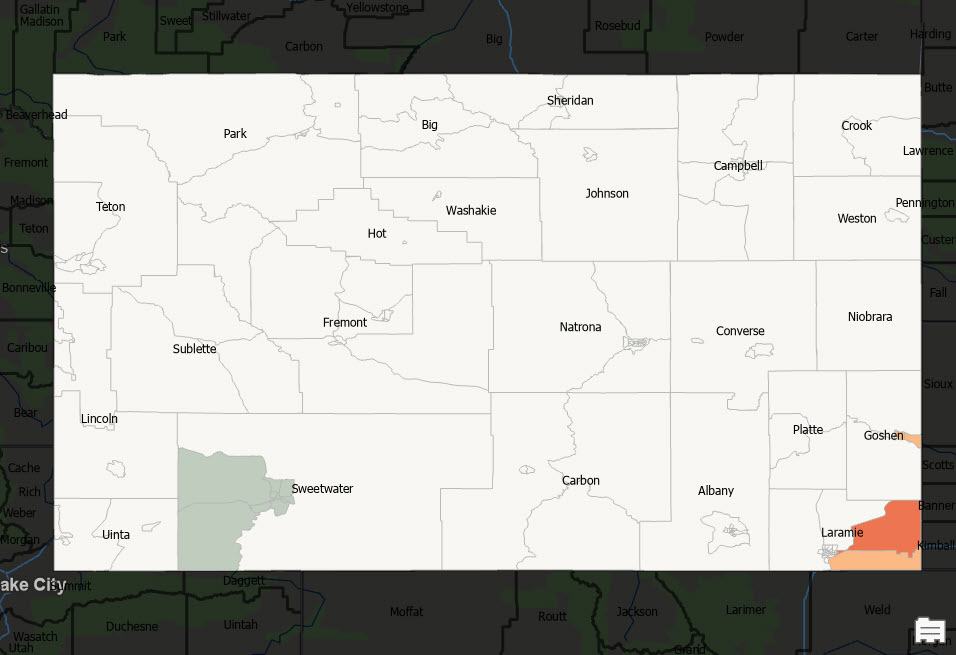
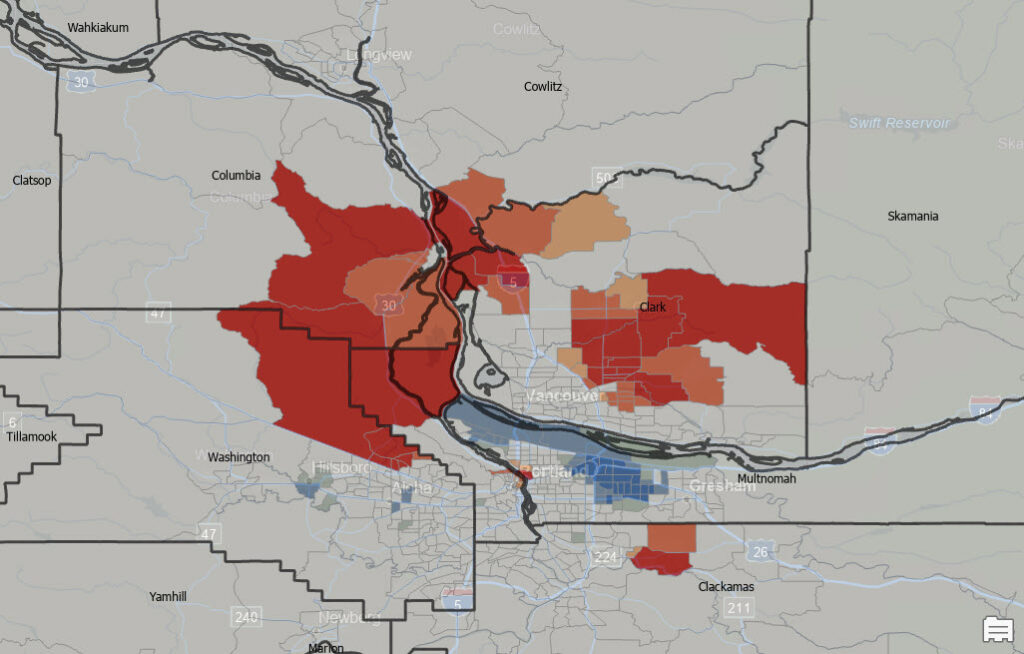
Growth hot spots are defined at a variety at the 90%, 95%, and 99% confidence levels and symbolized with a red color ramp. These represent population growth hot spots in the five year time period. Cold spots are also identified at the same confidence level and are mapped using a blue color ramp. These represent population decline. Tracts that didn’t have a statistically significant change in population are symbolized with an off white color.

We produced population growth hot spot maps for the following states in the western U.S.
Colorado
Utah
Idaho
Oregon
Washington
Greater Seattle Area
Montana
Arizona
California
Nevada
New Mexico
Wyoming
State Borders
Oregon – Washington
Arizona – Utah – Nevada
Colorado – Wyoming
California – Nevada
Idaho – Wyoming – Montana – Utah
In Sum
An analysis of population changes in the western United States over the past five years reveals significant demographic shifts, with urban centers like Denver and Boise thriving due to economic vitality and lifestyle appeal, while rural areas such as parts of Nevada and New Mexico struggle with population decline. Utilizing the R tidycensus package and the interpolate_pw() function along with the ArcGIS Pro Hot Spot Analysis Tool allowed for precise and detailed interpolation of ACS data, providing a clear picture of these trends at the census tract level. This granular approach not only highlights the regions experiencing growth and decline but also underscores the importance of nuanced demographic analysis in informing policy decisions and planning for sustainable development in the western United States.
