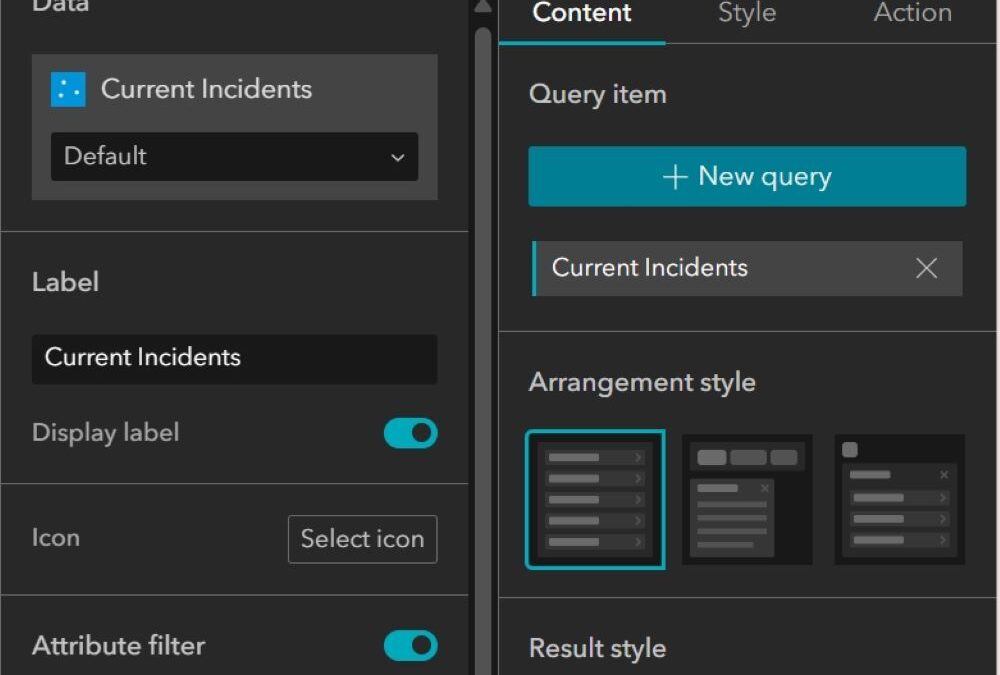
Configuring Attribute Queries in Experience Builder
Check out our upcoming in-person Experience Builder training in Denver, Billings, MT and other locations. What is the Query Widget? The Query Widget in ArcGIS Experience Builder empowers users to extract specific information from spatial datasets by applying filters...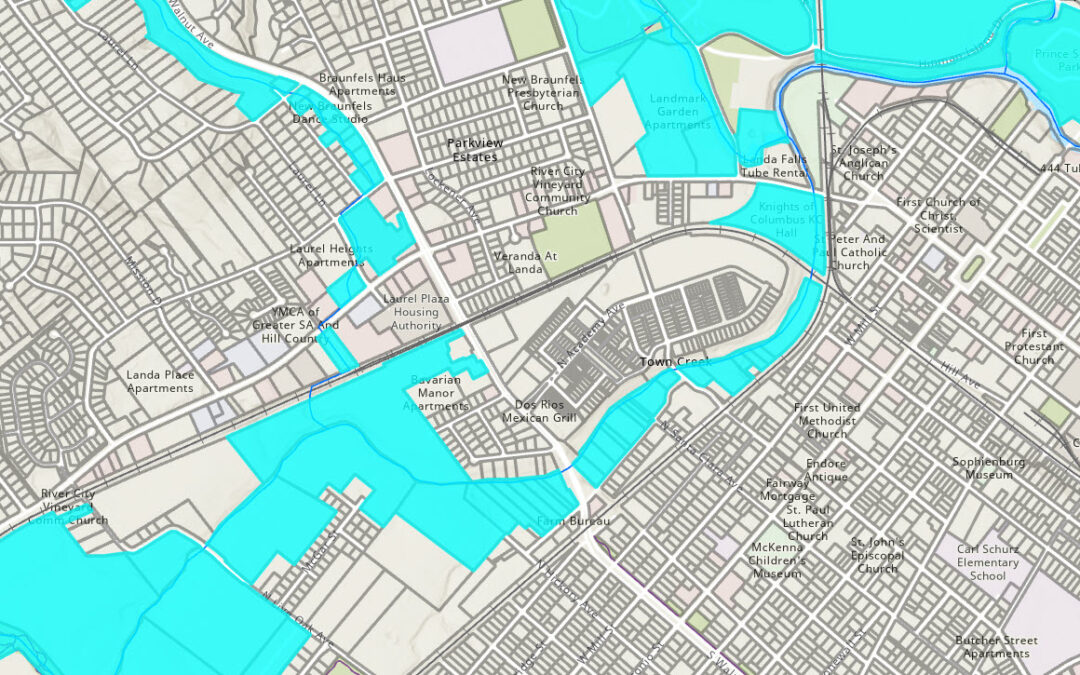
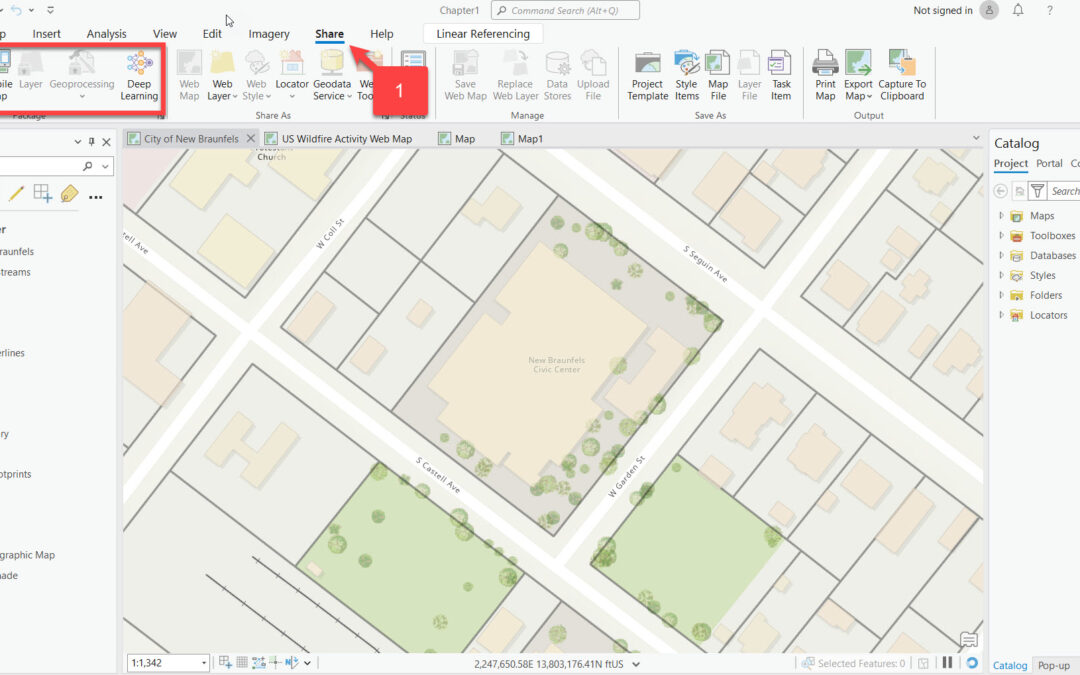
Mastering Spatial Selections: A Guide to ArcGIS Pro’s Select by Location Tool
Check out our upcoming in-person ArcGIS Pro training in Denver, Billings, MT and other locations. The “Select by Location” tool in ArcGIS Pro is a powerful feature that allows users to select features based on their spatial relationships to other features...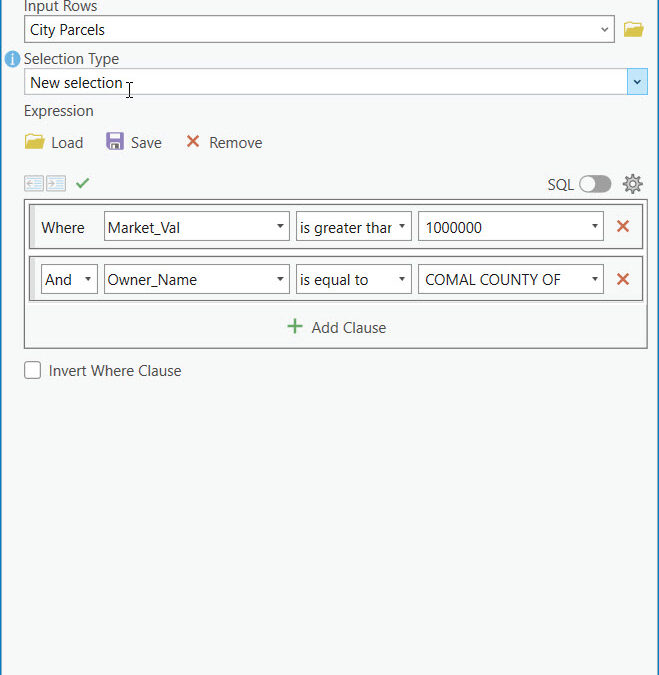
The Essential Guide to Attribute Selection in ArcGIS Pro
Check out our upcoming in-person ArcGIS Pro training in Denver, Billings, MT and other locations. Introduction In our last article we examined how to use interactive selection tools in ArcGIS Pro to filter features with a user defined geometry. ArcGIS Pro includes...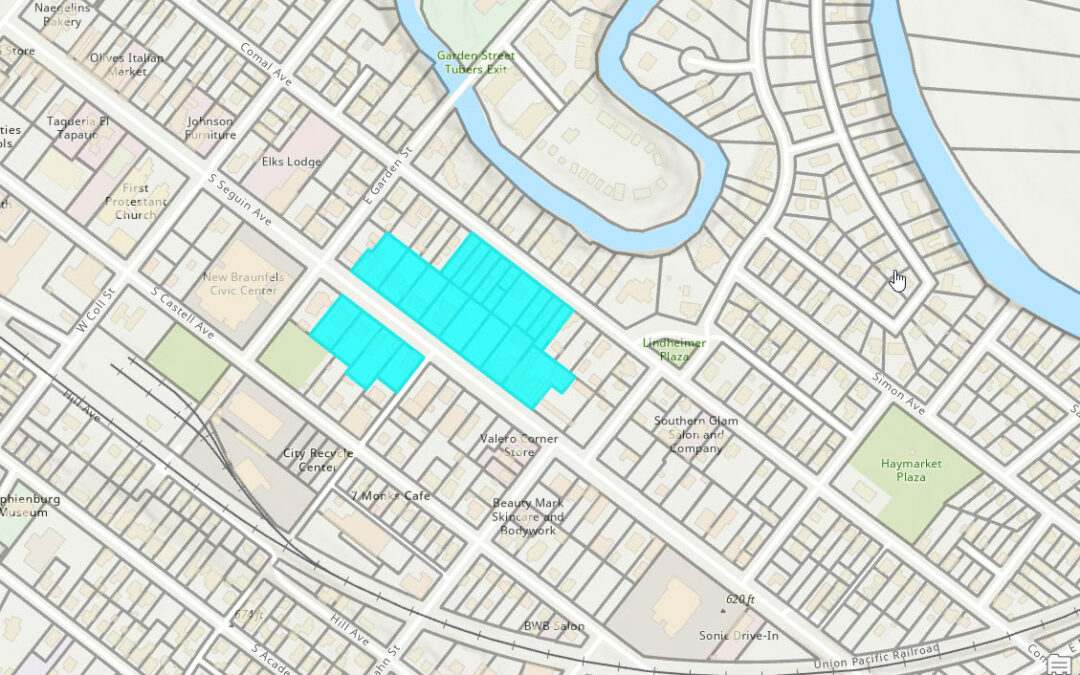
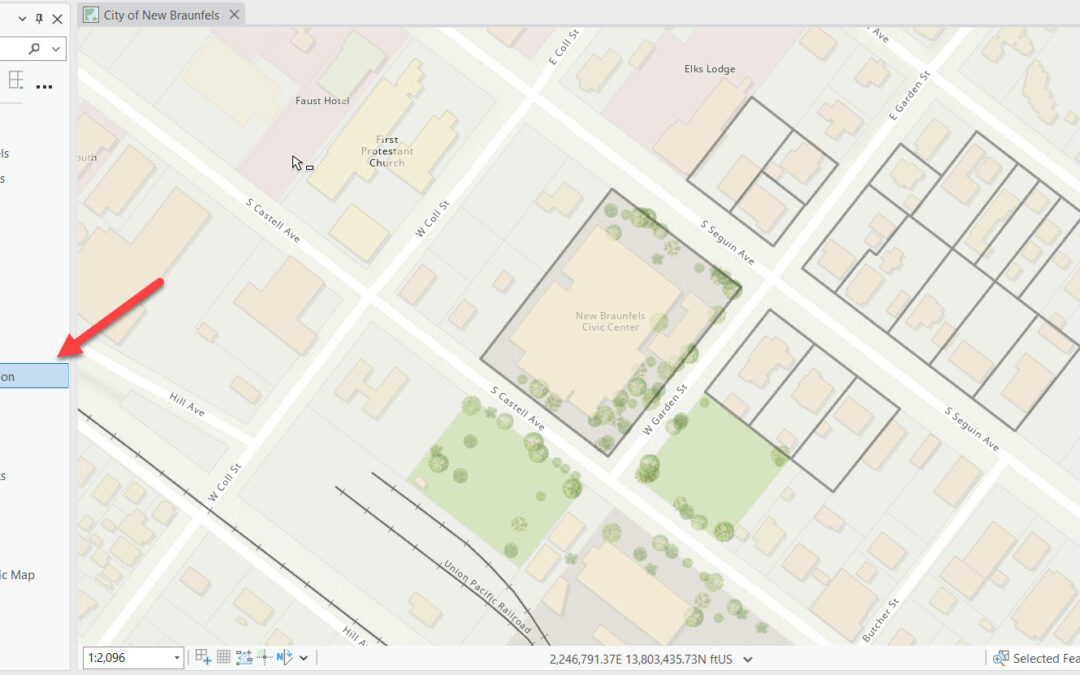
Creating Interactive Selection Sets in ArcGIS Pro: A Comprehensive Guide
Check out our upcoming in-person ArcGIS Pro training in Denver, Billings, MT and other locations. Introduction For GIS professionals the ability to efficiently select and analyze subsets of data is crucial. ArcGIS Pro offers robust tools for creating and managing...