ArcGIS Pro offers some powerful functionality to map population density.
In this tutorial, we’ll use population density data from the European Union to map population density values using the Natural Breaks (Jenks) method of classification. This method of classification is common in mapping population density because it finds natural breaks in datasets by minimizing variance within groups and maximizing variance between groups, allowing you to easily visualize differences in population density throughout a specific region.
STEP 1: Download the data
The EUROSTAT organization offers a shapefile containing population data for the whole European Union in grid sizes of 1 x 1km. Download the file here and unzip to a local file folder. Refer to the PDF inside the data folder for an explanation of what the data represents. Do the same for the Natural Earth quick start kit, which has polygon files for each country in the world. Open ArcGIS Pro and create a new, empty project. Add the following files to the map window:
- JRC_POPULATION_2018.shp (found in the JRC_GRID_2018 folder from EUROSTAT)
- Ne_10m_admin_0_countries.shp (found in 10m_cultural subfolder in the Natural Earth quick start kit)
STEP 2: Prepare the data
The EUROSTAT shapefile contains more than 2 million rows and is quite large. This is why we’ll make a selection of the data and analyze this: we’ll pick The Netherlands and only analyze data for this country. To do this, you can draw a rectangle on the map using the Select tool in the Map menu on the ribbon interface. Next, choose the Select Geoprocessing tool and run it to create a new feature class of that selected feature. Name it “Holland” and deselect the ne_10m_admin_0_countries.shp in the contents pane.
Next, apply the Clip tool using the JRC_POPULATION_2018 file as input feature dataset and the Holland polygon as Clip features. For the output feature class name, type “Population per sq/km in Holland”. The output feature class contains only the population density grid cells for Holland. Deselect the JRC_POPULATION_2018 feature class in the Contents pane.
STEP 3: Make a sub-selection of the current dataset
To map the population density of the entire country, we now have everything we need: a dataset of grid cells covering the entire country. If you open the attribute table of the resulting feature class created in Step 2 with the Clip tool, you will see that each cell is 1 x 1 km (area field). The total population for that cell is listed in the TOT_P_2018 field. Research learns that the mean population density in the Netherlands per square km is 523 people. We can use that information to filter only the grid cells in our data to see where population density exceeds this number. To do this, open the attribute table of the lastly created feature class in Step 2 and click “Select by Attributes” on the ribbon interface under “Map”. Under input rows, make sure the current feature class name is selected. Under “Selection Type”, choose “New Selection”. Add a Where Clause: WHERE TOT_P_2018 is greater than 523. Click “Apply”. Next, right-click the Population per sq/km in Holland feature class in the Contents pane and choose Selection -> Make Layer from Selected Features. You now have a layer with only the grid cells containing more than 523 people per square km. With the Holland polygon used as a background, the results should like this:

STEP 4: Use Map Symbology to find the highest population density values
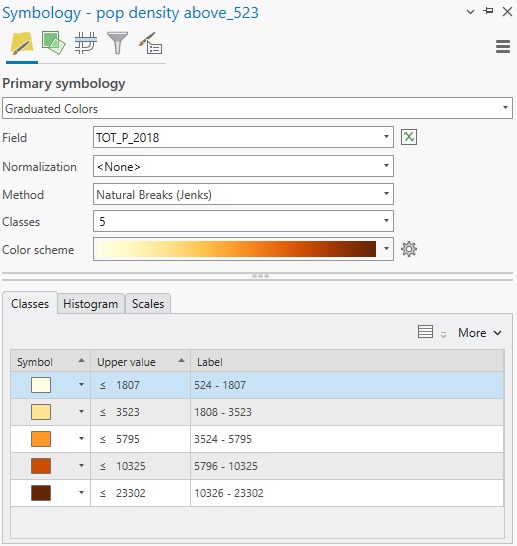
We can now use map symbology to differentiate between the different population values per grid cell. To do this, right-click the ultimate created feature class and select Symbology.
Use the following Symbology values to create multiple classes covering all population values:
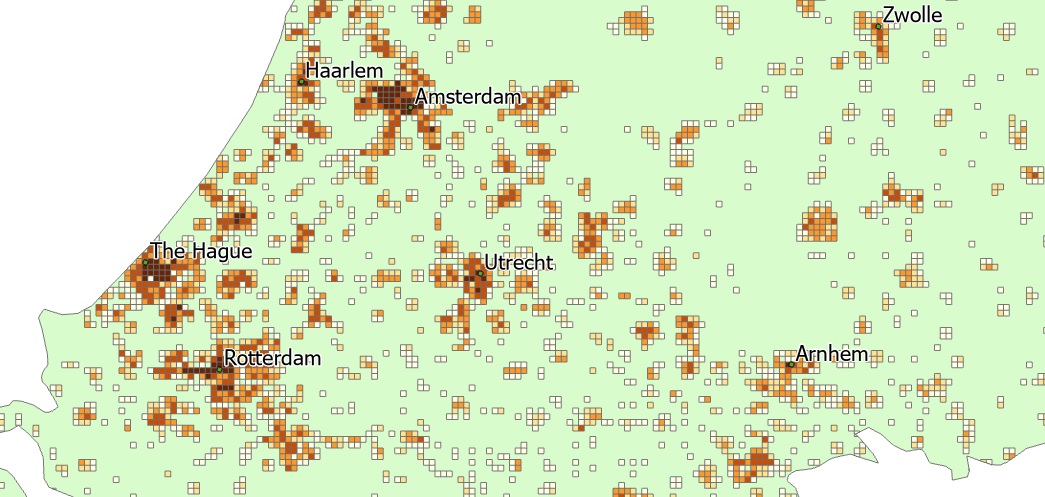
Zoom in the different zones to see where the darkest values are, representing higher values. Combined with labels from the ne_10m_populated_places.shp, we can see that these are found near the coastline cities The Hague and Rotterdam, as well as Amsterdam: