In this tutorial, you’ll learn how to measure distances of rivers and use Python to show these on a map using a label class.
ArcGIS Pro offers flexible labeling capabilities to communicate multiple properties of a single feature to the map reader. Here, we’ll use a dataset with river line features to display their names and length in kms. To do this, we’ll have to calculate the length for each river and store it in an attribute table. This info can be displayed on the map along with the name of each river using a simple Python expression. It should be noted that the calculated lengths for each river below are not accurate. The main purpose of this tutorial is to show how you can use Pro’s labeling functionality to easily create your own label classes.
Step 1: Download the data
This tutorial uses the Natural Earth quick start kit. Download the data here, unzip to a location on your hard drive and open a new project in Pro. Create a folder connection using the Catalog pane to the dataset, next drag and drop the following two shapefiles to the map window from the 110m_physical subfolder:
- ne_110m_land
- ne_110m_rivers_lake_centerlines
Right-click the ne_110m_rivers_lake_centerlines feature class name in the Contents pane and select “Labels” to show the names of the rivers on the map. Next, we’ll create a length property and show it together with the river names.
Step 2: Create a length field in the attribute table
Open the attribute table of the ne_110m_rivers_lake_centerlines. Click the “Add” button on the top left of the table to add a new field. Fill in the field properties as displayed below: field name is “Length”, data type is “Long” and number format is “Numeric”. Right-click and save the field name so it is added to the table. We’ll now populate the individual field values.

Step 3: Calculate the field values for each river
Select the attribute table so you can see all field values. Scroll to the far right to see the newly added Length field with field values of 0. Right click the Length field name and select “Calculate Geometry”. Use the parameters displayed below to calculate the length of each line feature. I used a coordinate system for the output value that preserves distance, but only up to a certain level. Therefore, the resulting lengths are not accurate – I assume that using other data from this dataset with different scale levels will give more accurate results.
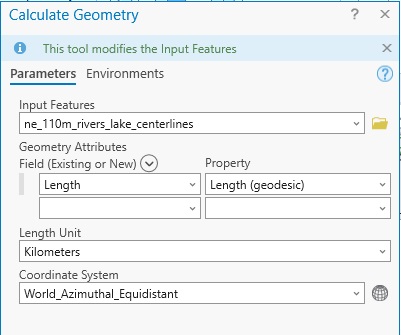
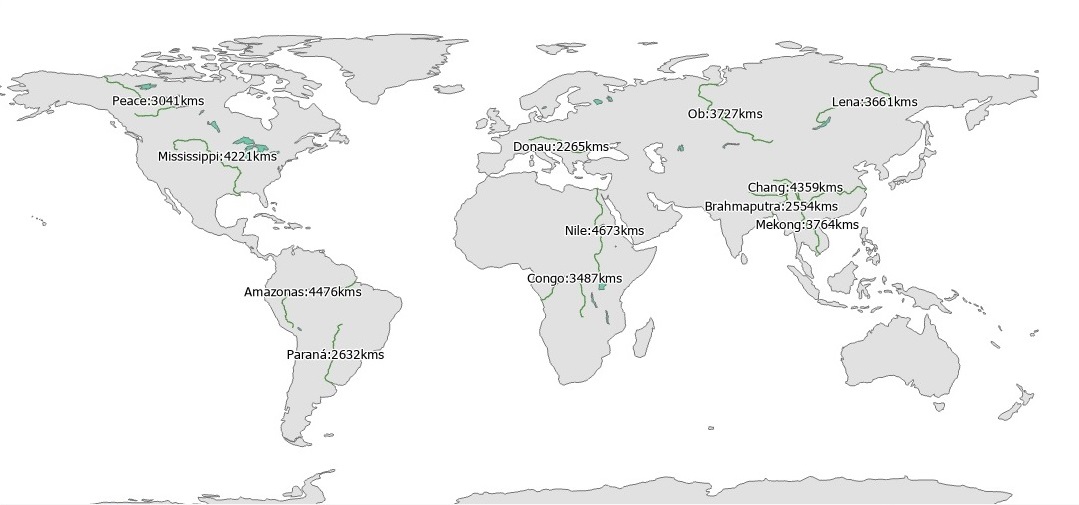
Click “OK” to run the tool and populate the length in kms for each river. Right-click the “Length” field name again and choose “Select Descending” to see that the river Nile is the longest river on earth.
Step 4: Create a new label expression showing both the river name and length Right-click the ne_110m_rivers_lake_centerlines feature class in the Contents pane and select “Labeling Properties”. Set the language to “Python” instead of “Arcade” and use the following expression to create labels for each river showing the name and length in kms.
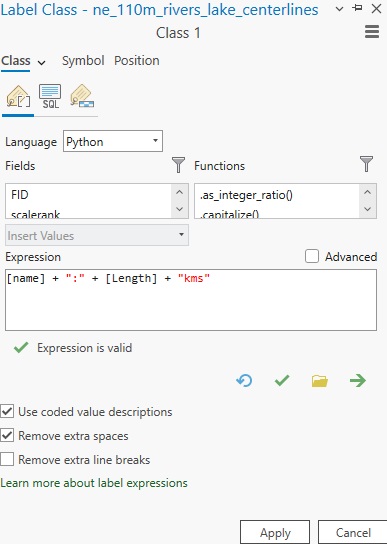
Click “Apply”. The expression uses both the “name” field and the “Length” field values, instead of showing only the name as was the case before changing the label property. Adding a white halo around the black letters results in the following map, displaying the newly created label class: