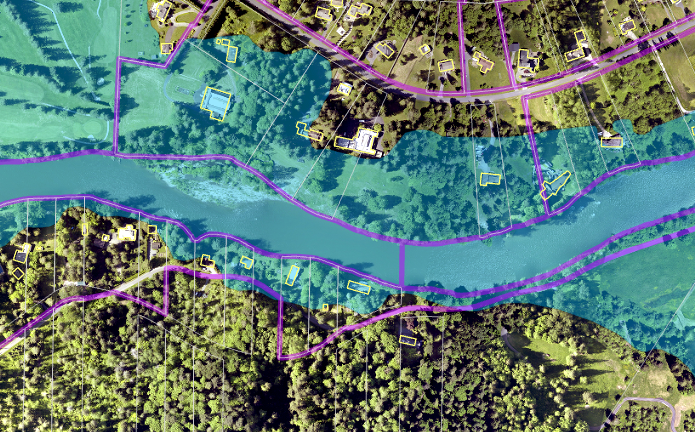
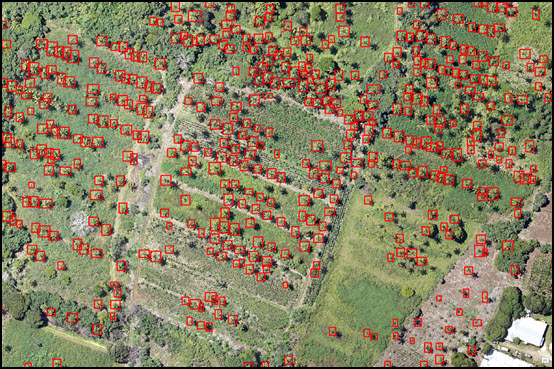
ArcGIS Pro 2.3 Introduces New Deep Learning Tools
The latest version of ArcGIS Pro features new deep learning tools that let users train their data in an external deep learning model and use the results to model or classify their imagery within the ArcGIS platform. What is deep learning and how can it improve...
Free Chapter: Data Visualization and Exploration with R
My latest book, Data Visualization and Exploration with R, has been published, and you can download a free chapter. The book is available in both hard copy and digital formats. You will also want to download and install the exercise data. This book uses RStudio, so...
Data Visualization and Exploration with R
My new book, Data Visualization and Exploration with R, has been published in digital format and printed paperback versions. This book is a practical guide to using R, RStudio, and tidyverse for data visualization, exploration, and data science applications. $39.00...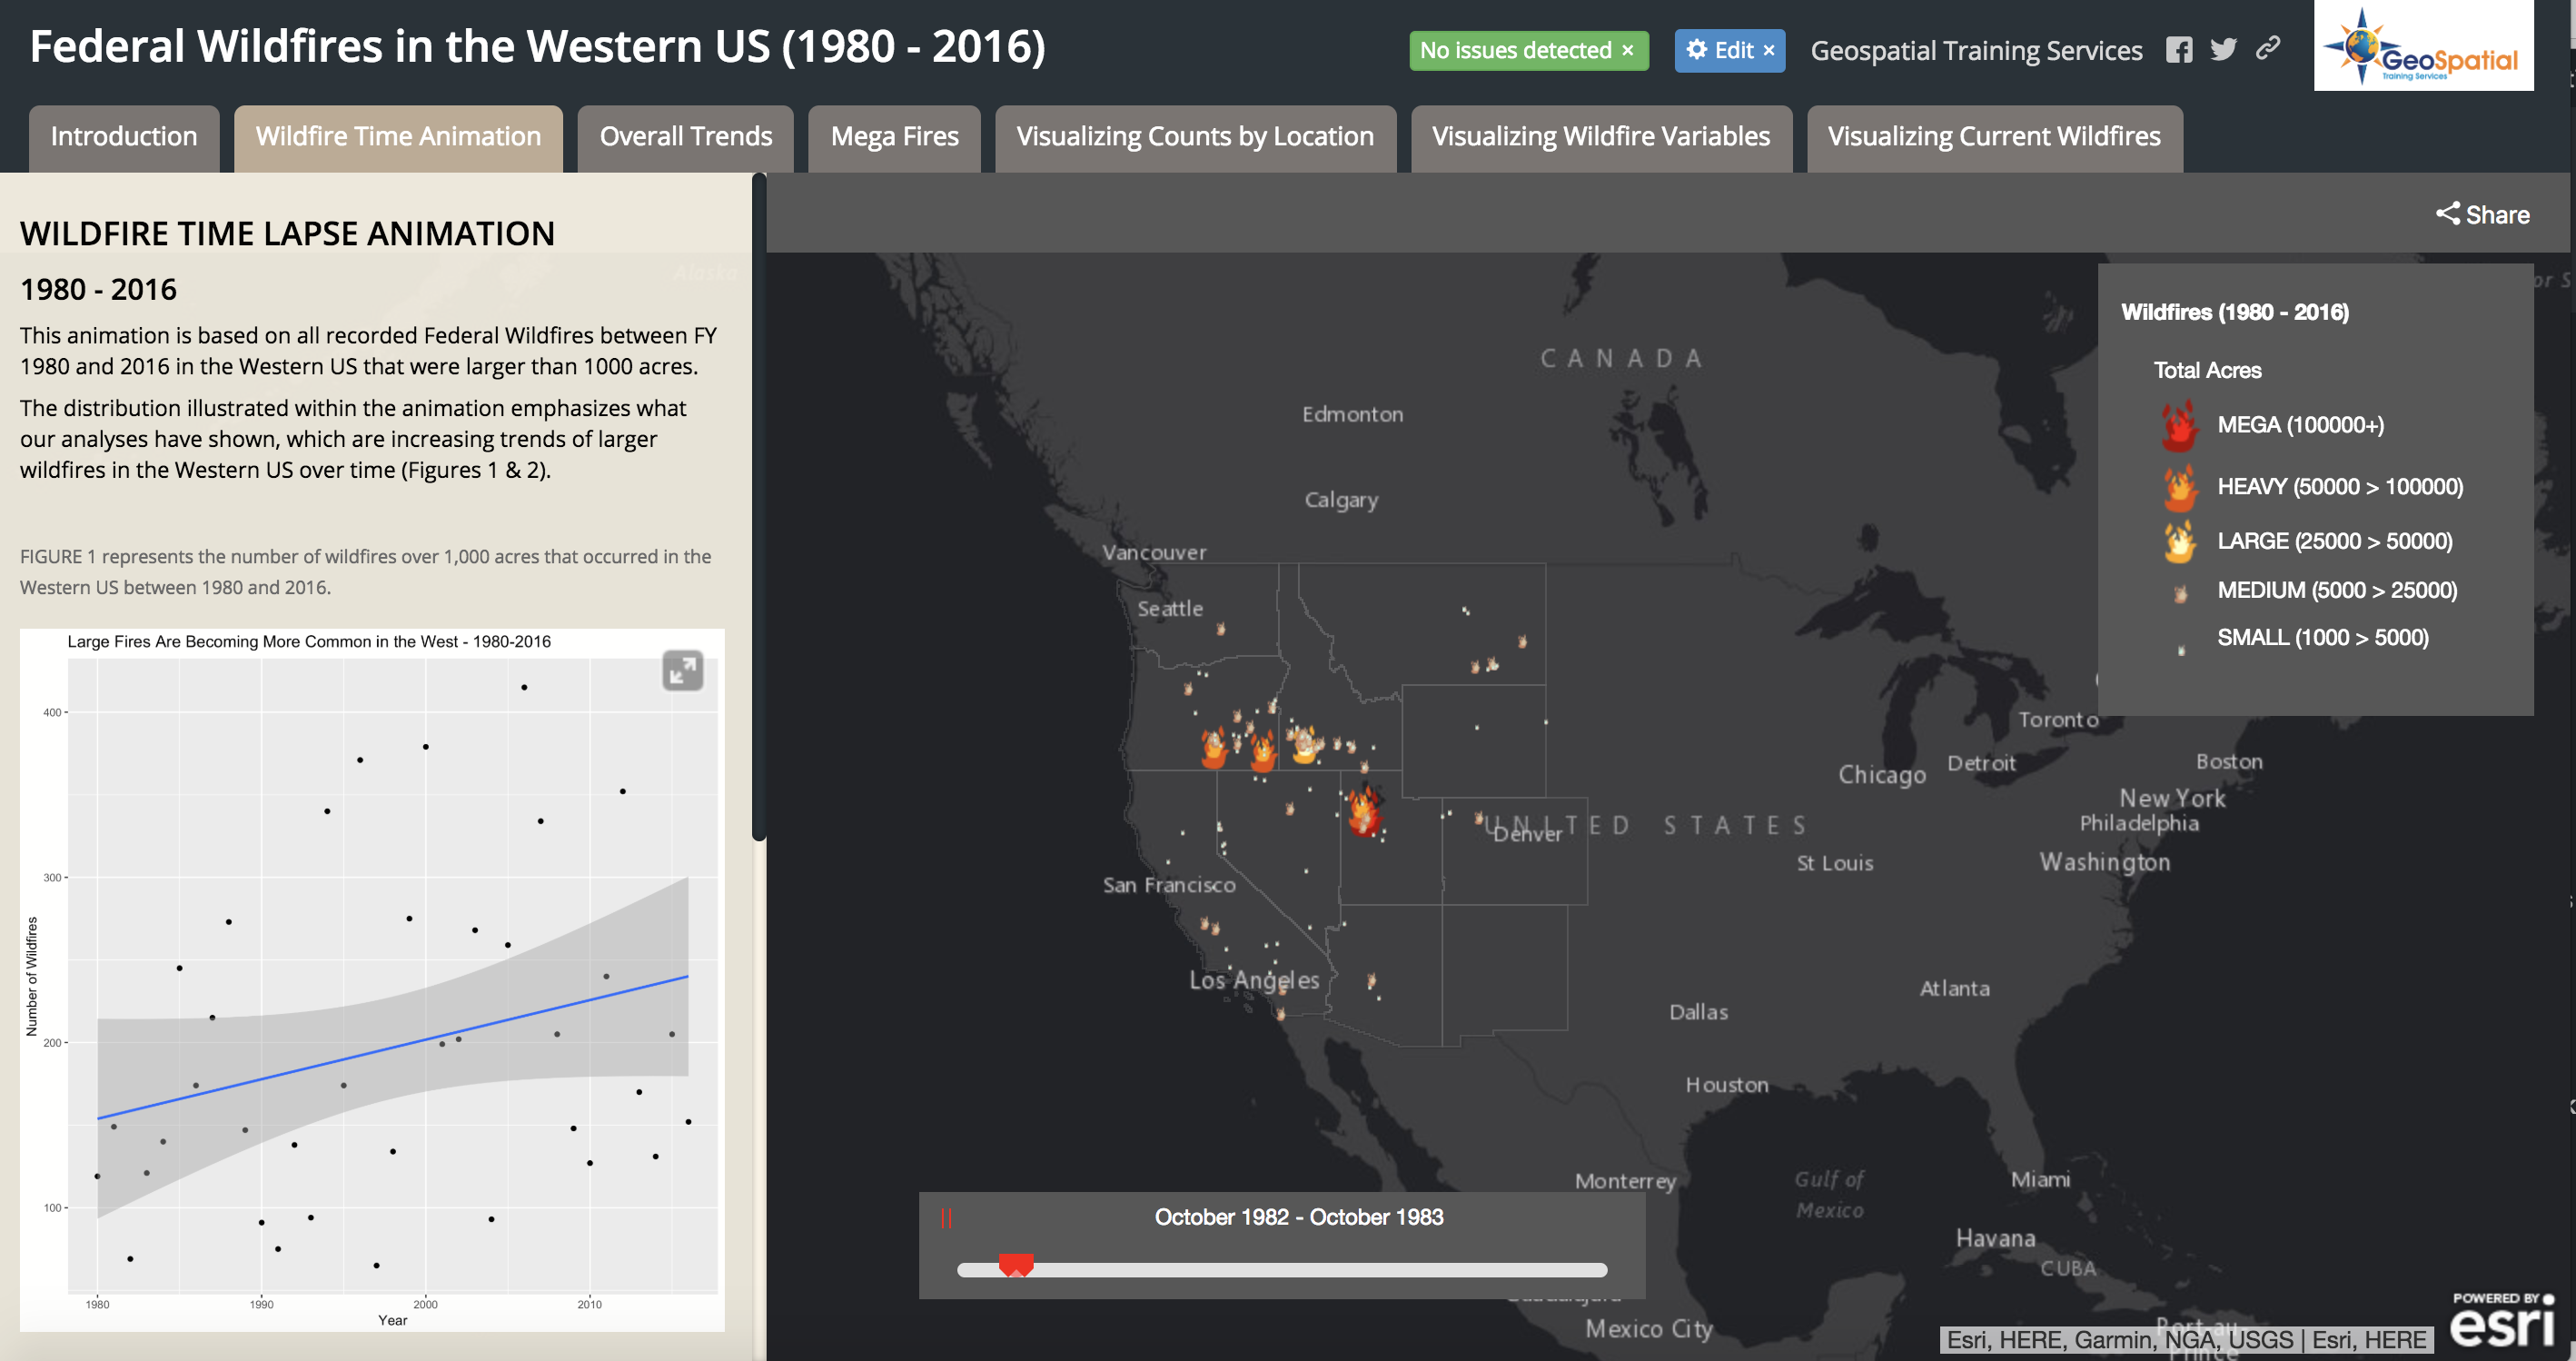
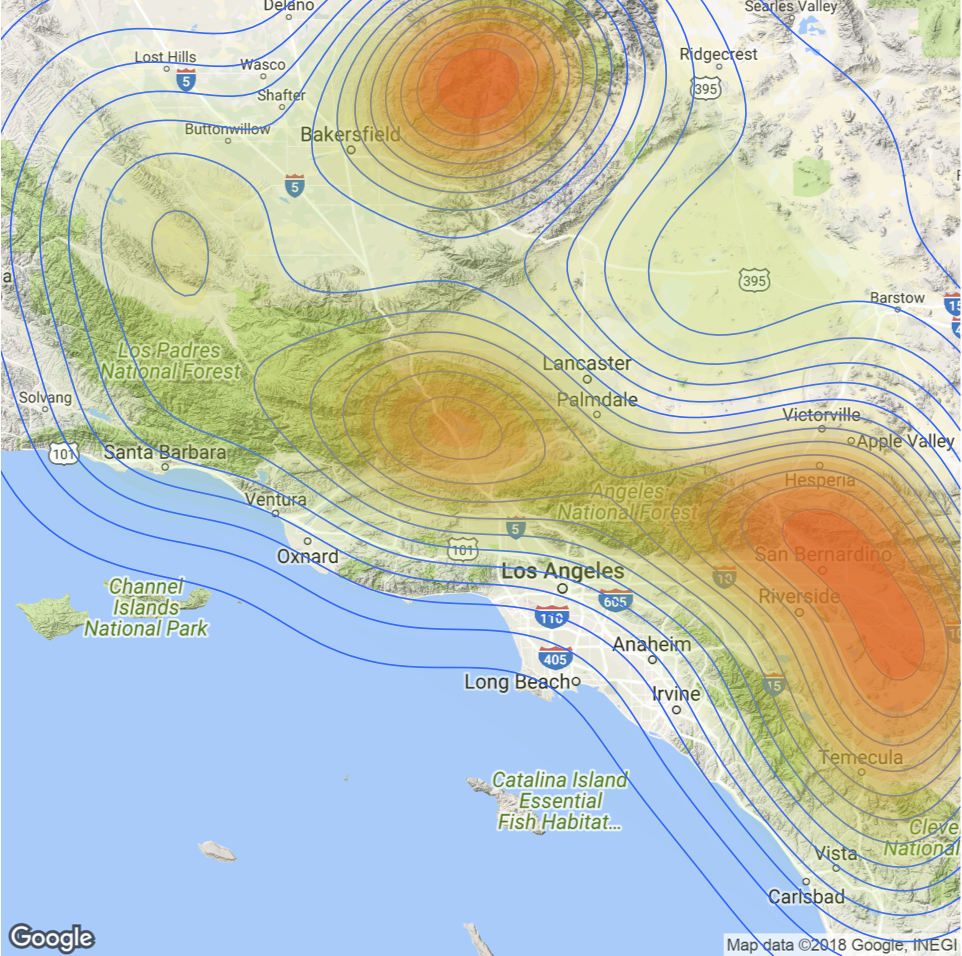
Visualizing Historical Wildfire Information in a Story Map
The 2017 wildfire season shattered records and cost the U.S. Forest Service an unprecedented $2 billion. From the Oregon wildfires to late season fires in Montana, and the highly unusual timing of the California fires in December, it was a busy year in the Western...