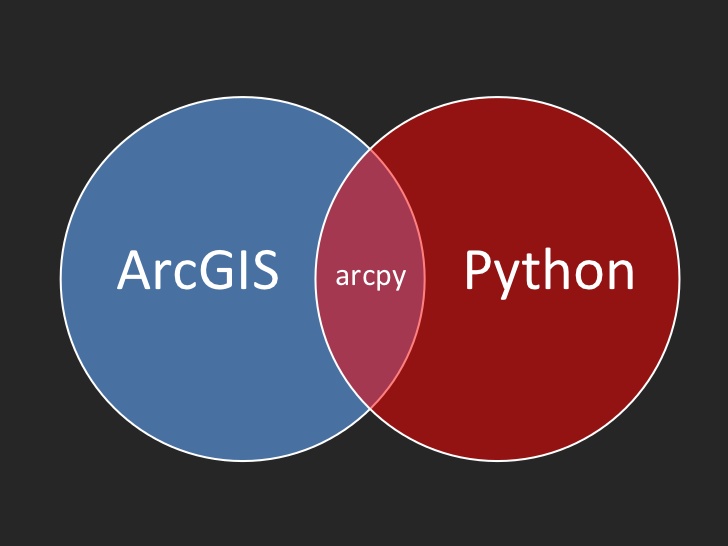
Create a Script Tool in ArcGIS Pro from a Python Script
In this tutorial, you’ll learn how to create a script tool in ArcGIS Pro from a standalone Python script. A script tool is a Python script file that can be run as a geoprocessing tool. This means you only have to worry about setting the right parameters of the tool...
Is Now a Good Time to Buy a New Computer for GIS?
Today we have a guest post from Tripp Corbin, Business Development Manager for SAM, LLC. I have been pondering building a new computer. (Yes, I build my own systems) My current personal workstation is now several years old and is now two generations behind the most...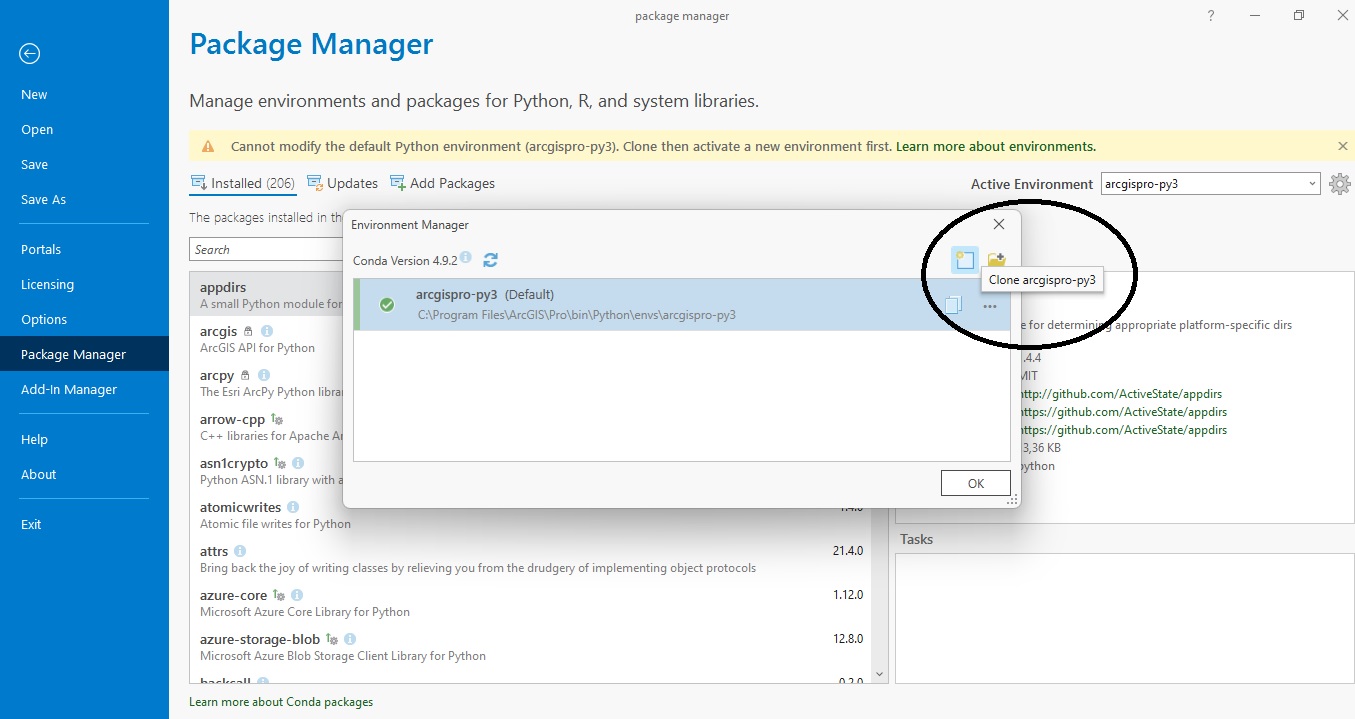
Tutorial: Managing Python Packages with Pro’s Package Manager
In this tutorial, we’ll have a look at Pro’s new Package Manager. This package management system lets us install, update and delete Python packages that are grouped into separate, named Python environments. What is Pro’s Package manager and what is it used for? ArcGIS...
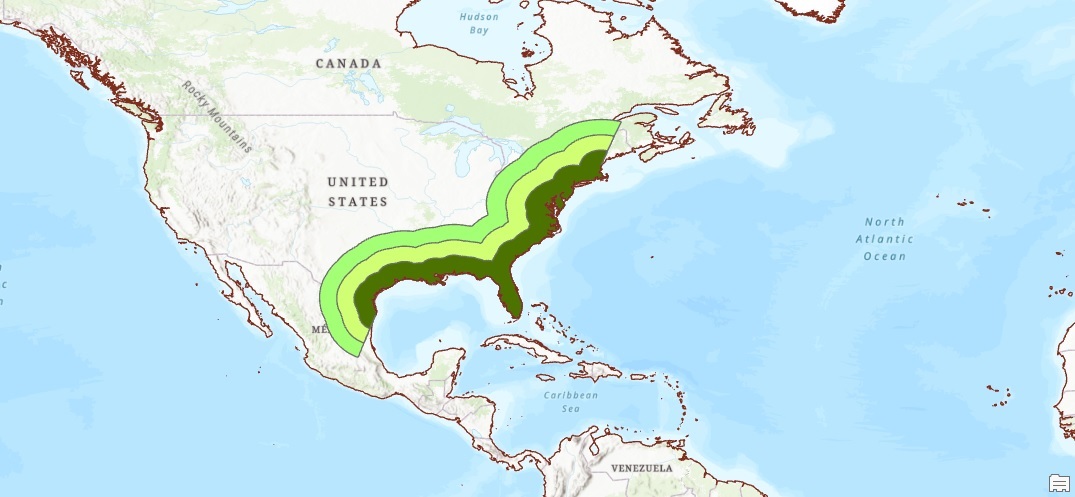
Tutorial: Using Pairwise Buffering, Dissolve and Clip Tools
This tutorial shows how to speed up your GIS workflow with three tools that use parallel processing. These tools are recommended for use when you have many features to be processed at once. GIS analysis often involves the use of buffering, dissolve and clip tools....