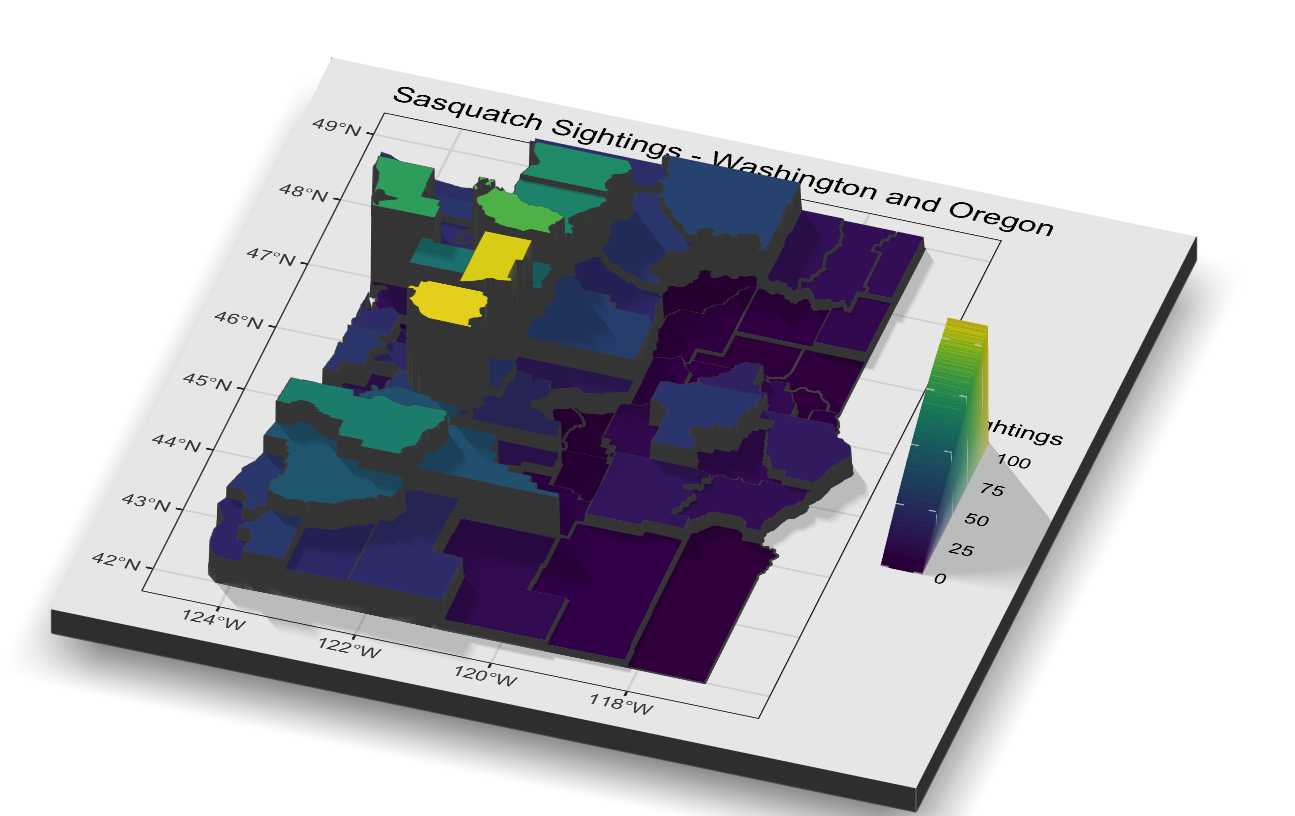
3D Mapping of Sasquatch Sightings in R with Rayshader
Prior articles in this series Introduction to GIS Analysis using Sasquatch SightingsSpatial Squatch – Using the ArcGIS Pro Spatial Statistics Toolbox to Identify Sighting PatternsMapping Clusters of Sasquatch SightingsSasquatch Sighting Heat Maps with R In this...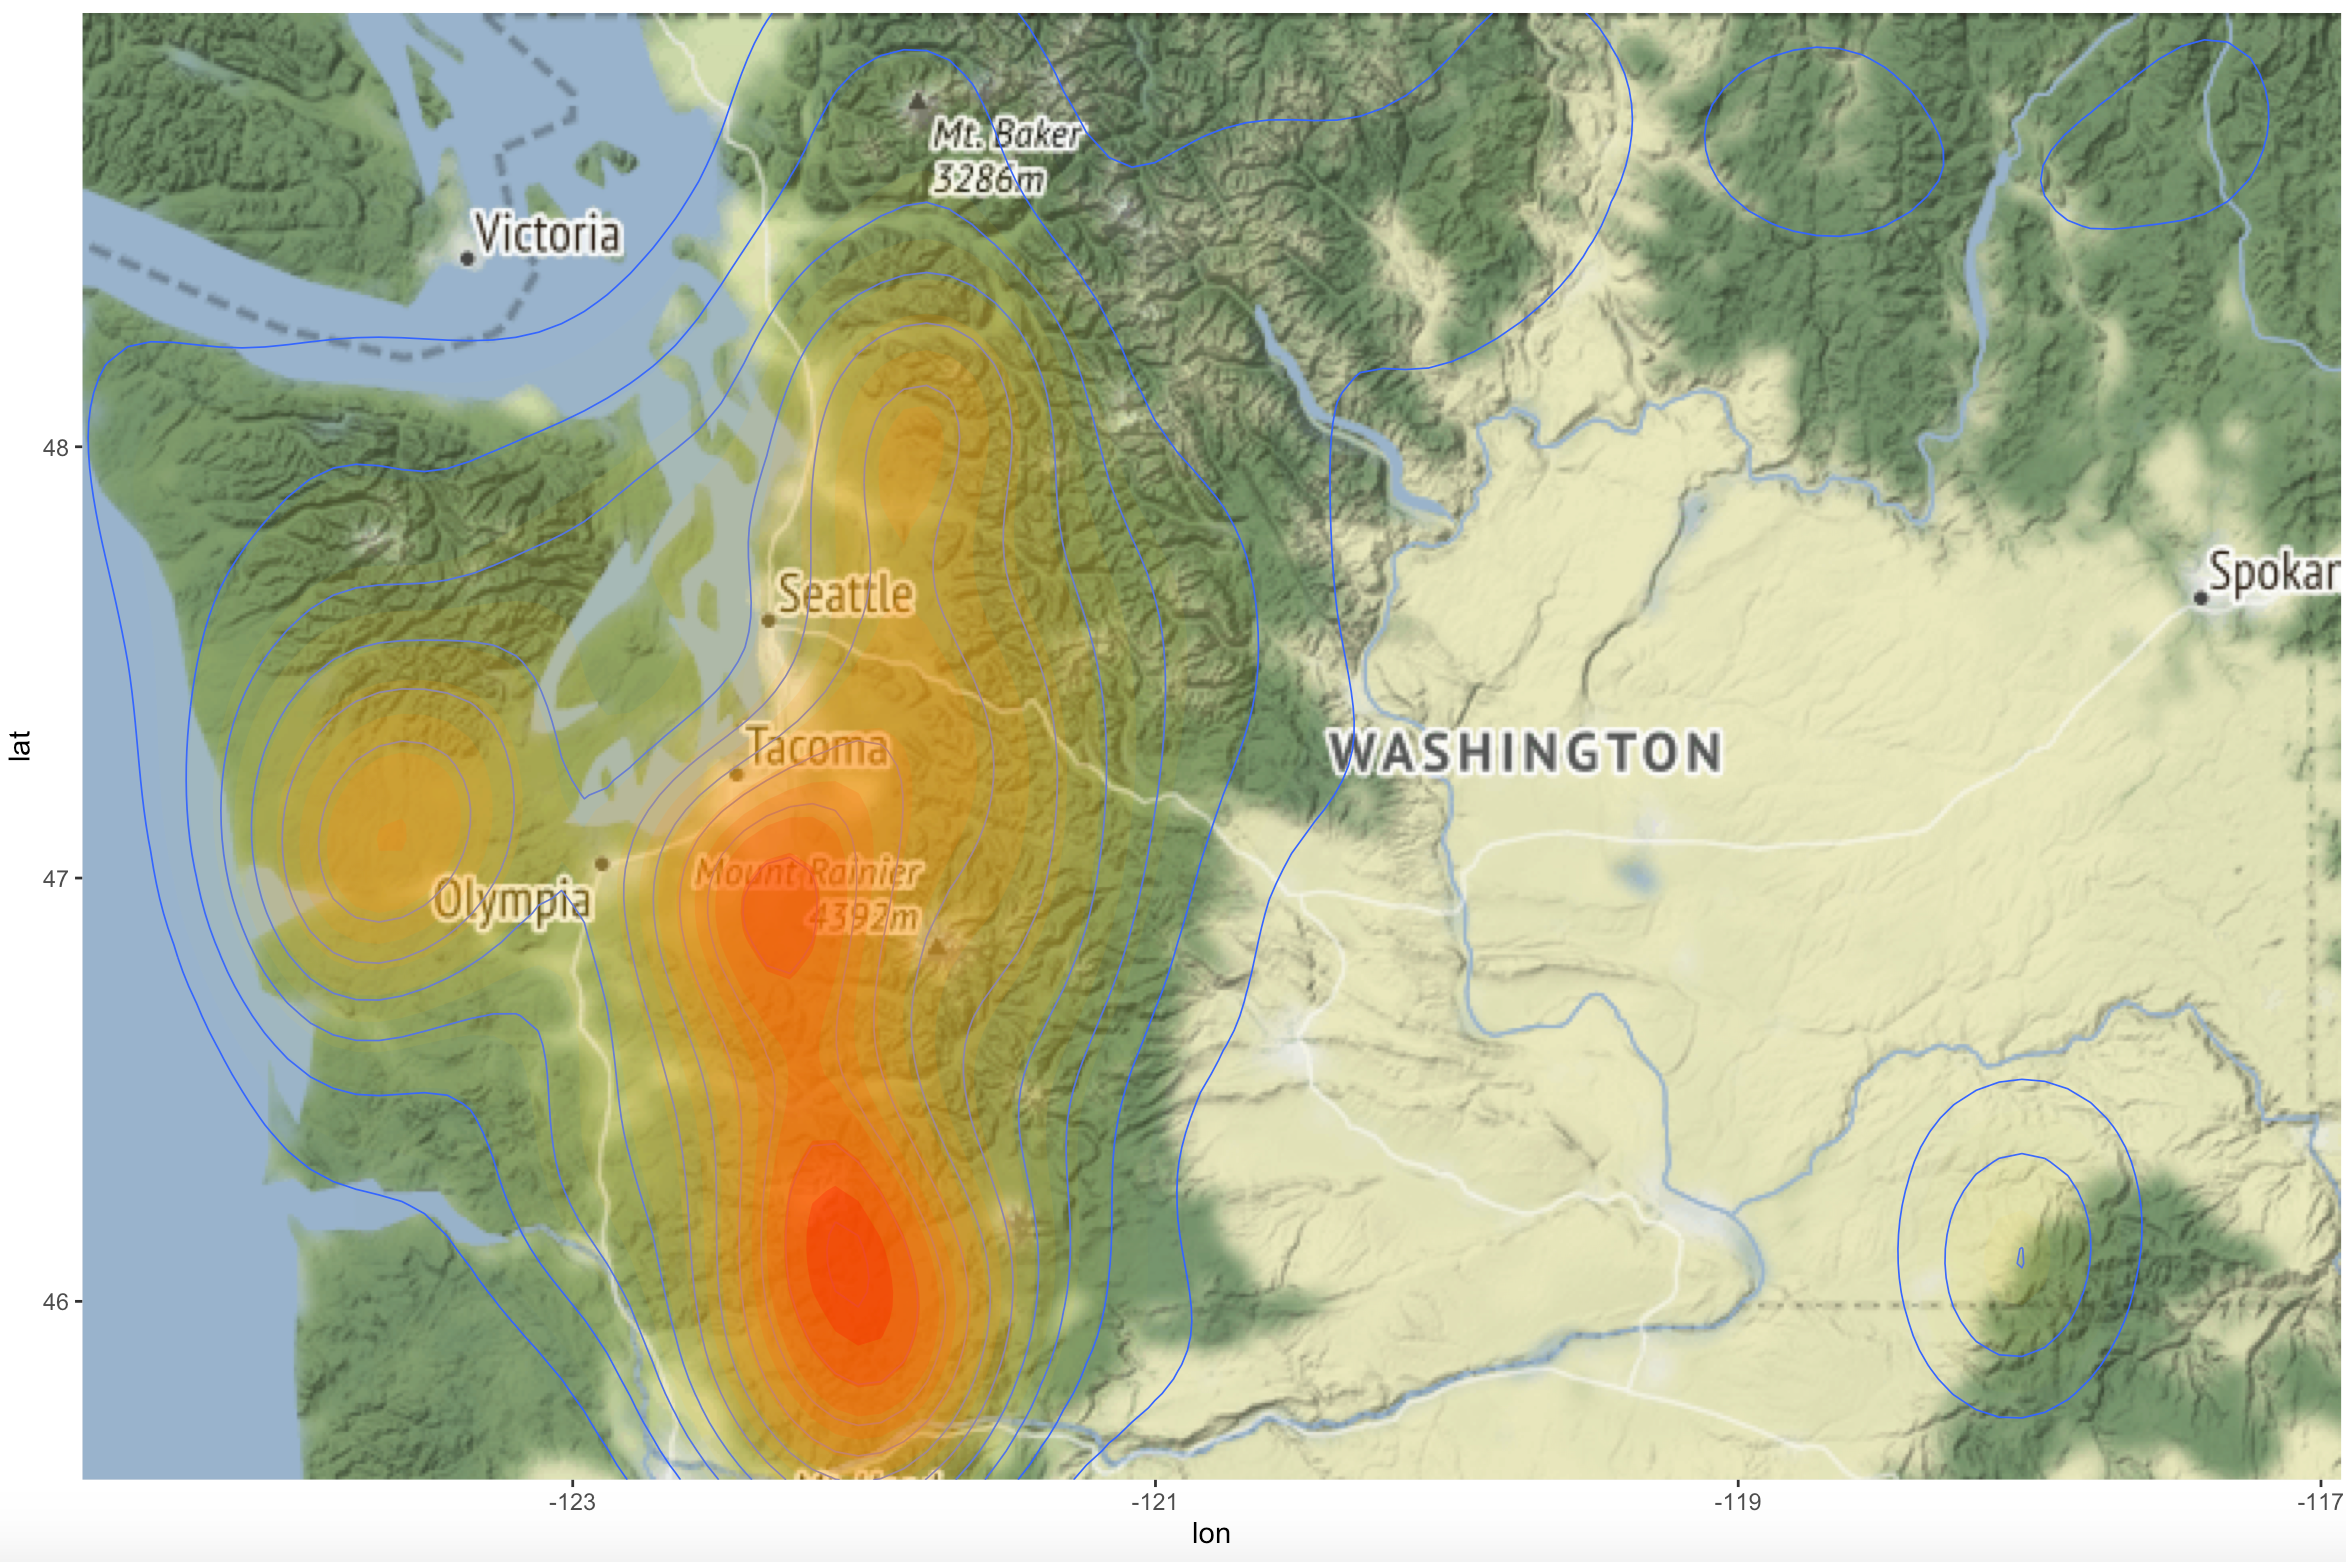
Sasquatch Sighting Heat Maps with R
Prior articles in this series Introduction to GIS Analysis using Sasquatch SightingsSpatial Squatch – Using the ArcGIS Pro Spatial Statistics Toolbox to Identify Sighting PatternsMapping Clusters of Sasquatch Sightings In this article I’ll deviate a little from...
4 New Training Bundles – Self-Paced and Live-Online
Today we’re announcing the availability of 4 new GIS training bundles for both self-paced and live-online GIS training opportunities. These new bundles will supplement our 2 existing bundles, and provide you with the ultimate flexibility for obtaining the latest...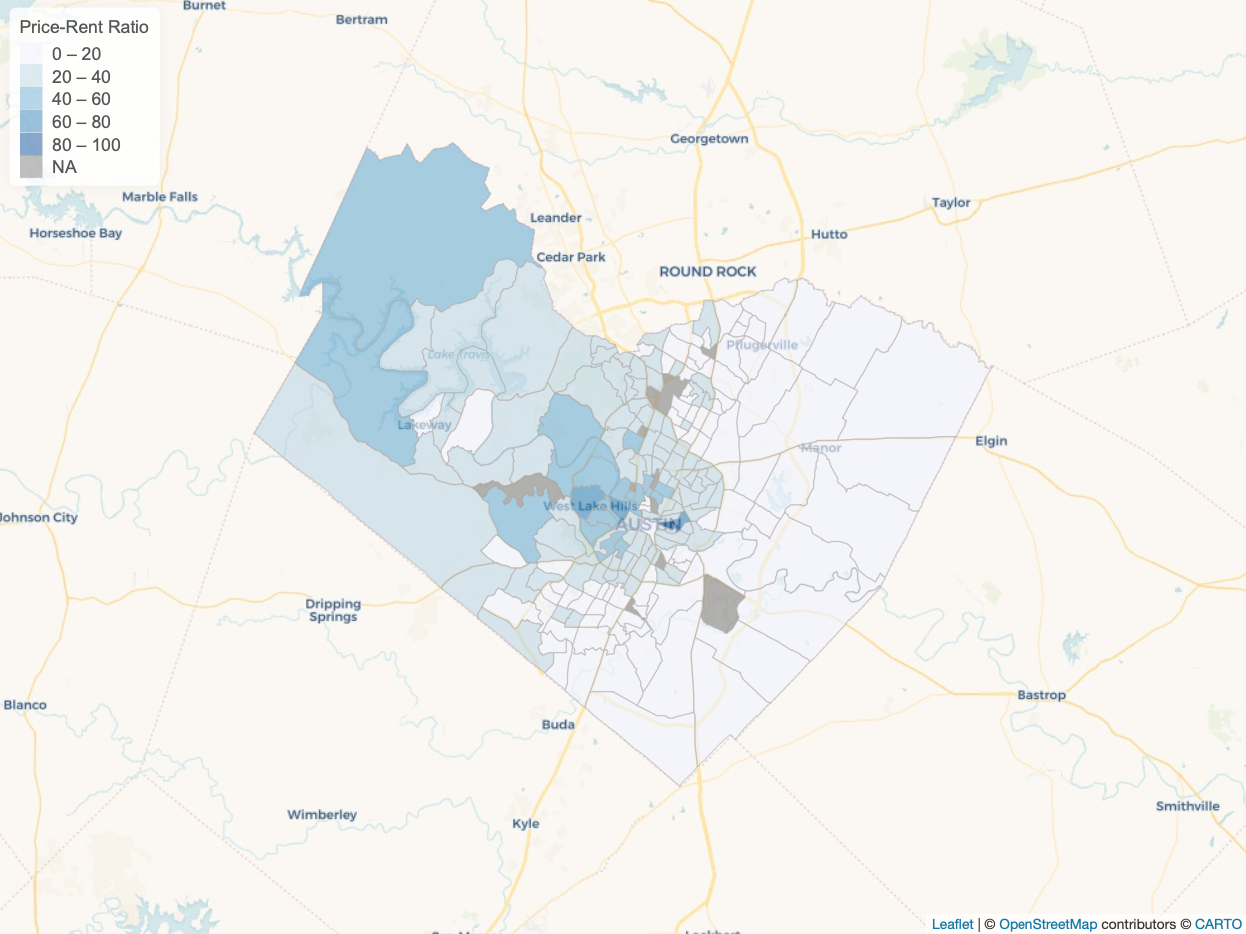
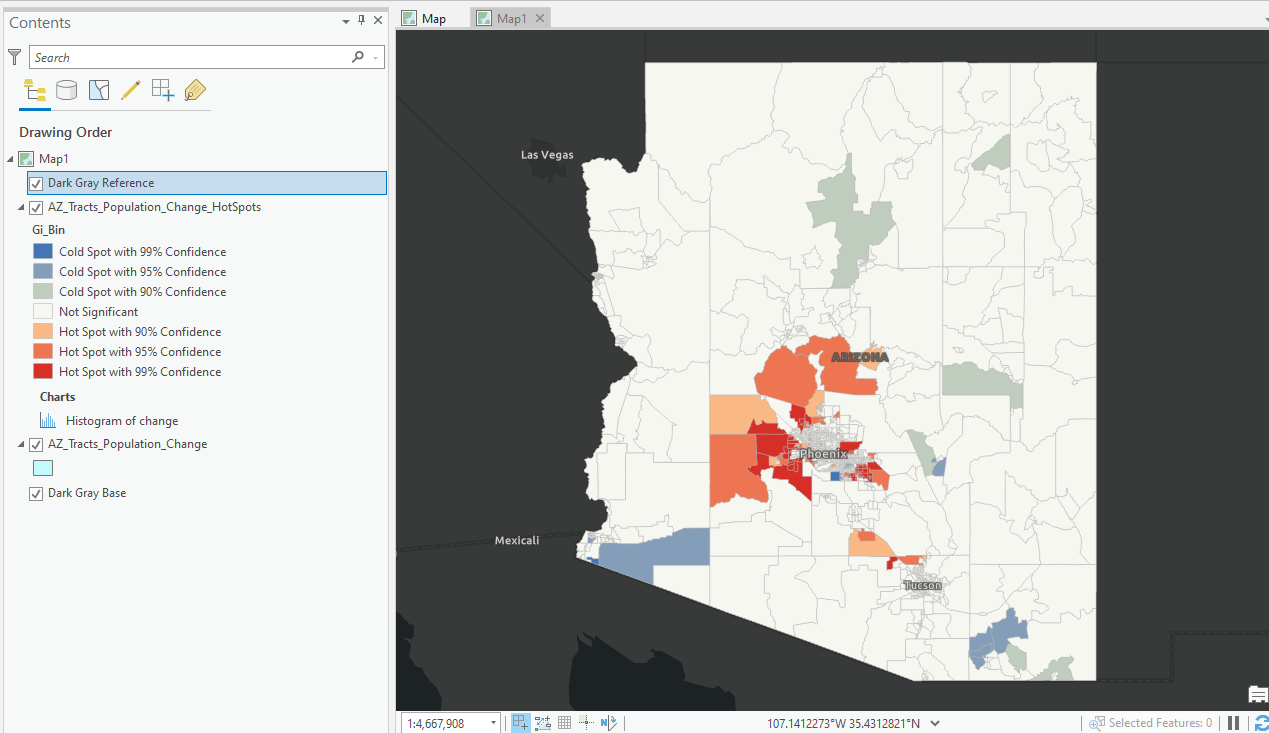
Automating Census Map Production with R
Many of our readers regularly work with U.S. Census data for mapping and analysis purposes. Whether you work with these datasets every day or just every now and then to create a simple map you’ve no doubt discovered how difficult it can be to decipher census...