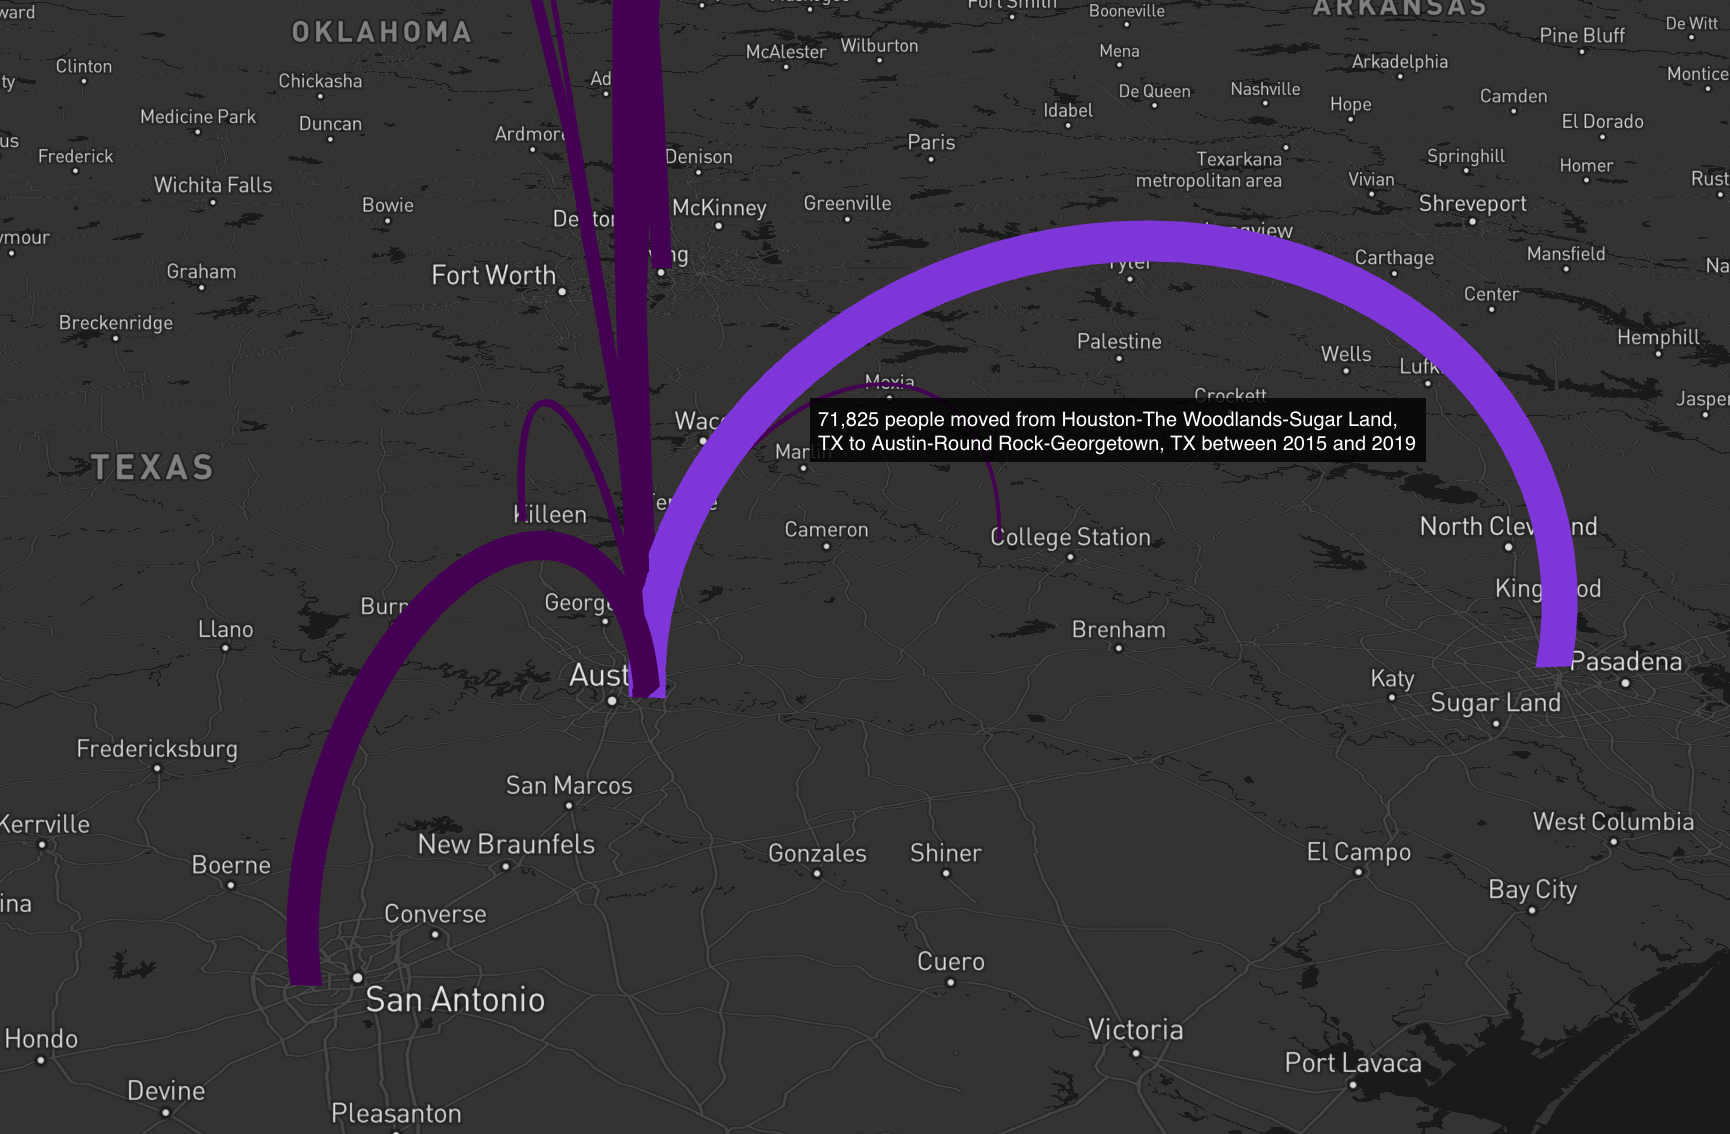
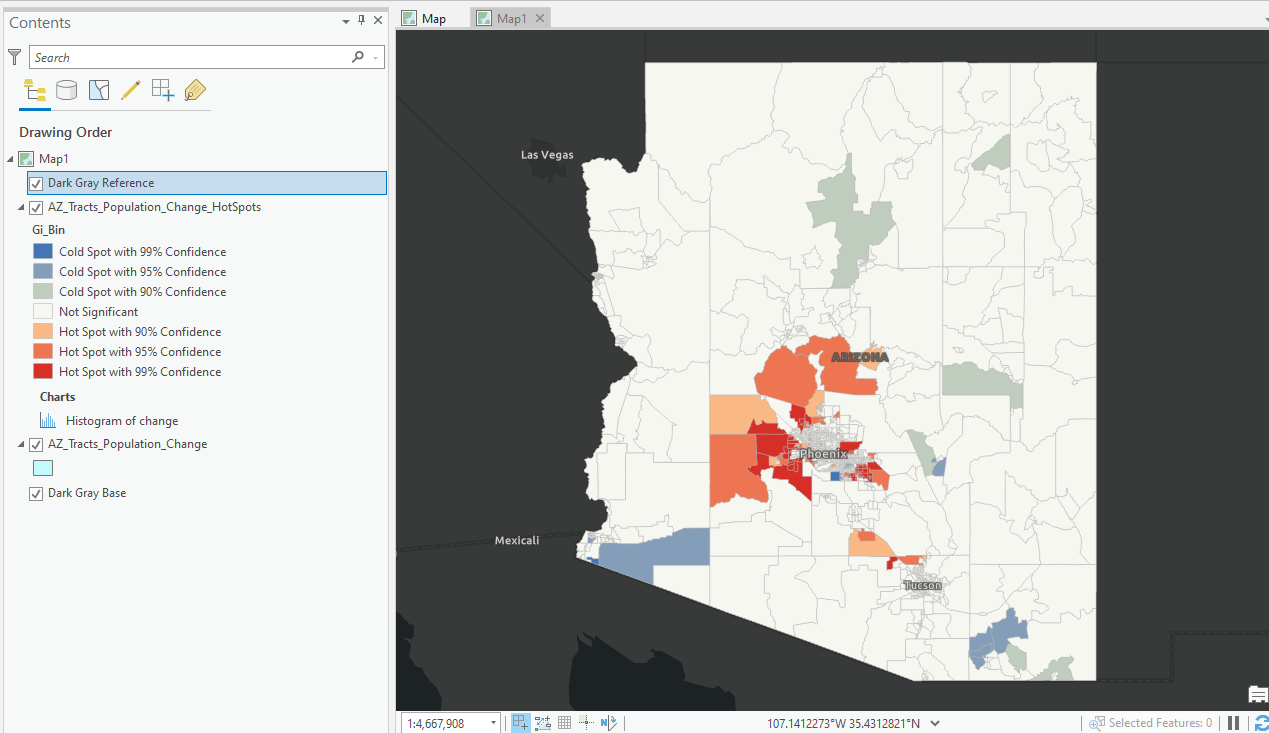
Mapping Population Growth Hot Spots with R and ArcGIS Pro
This tutorial demonstrates how to use R and ArcGIS Pro to generate hot spot maps of population growth by census tract. In a previous article I showed you how to use the tidycensus R package to quickly access and map US census data. You can also download a free copy of...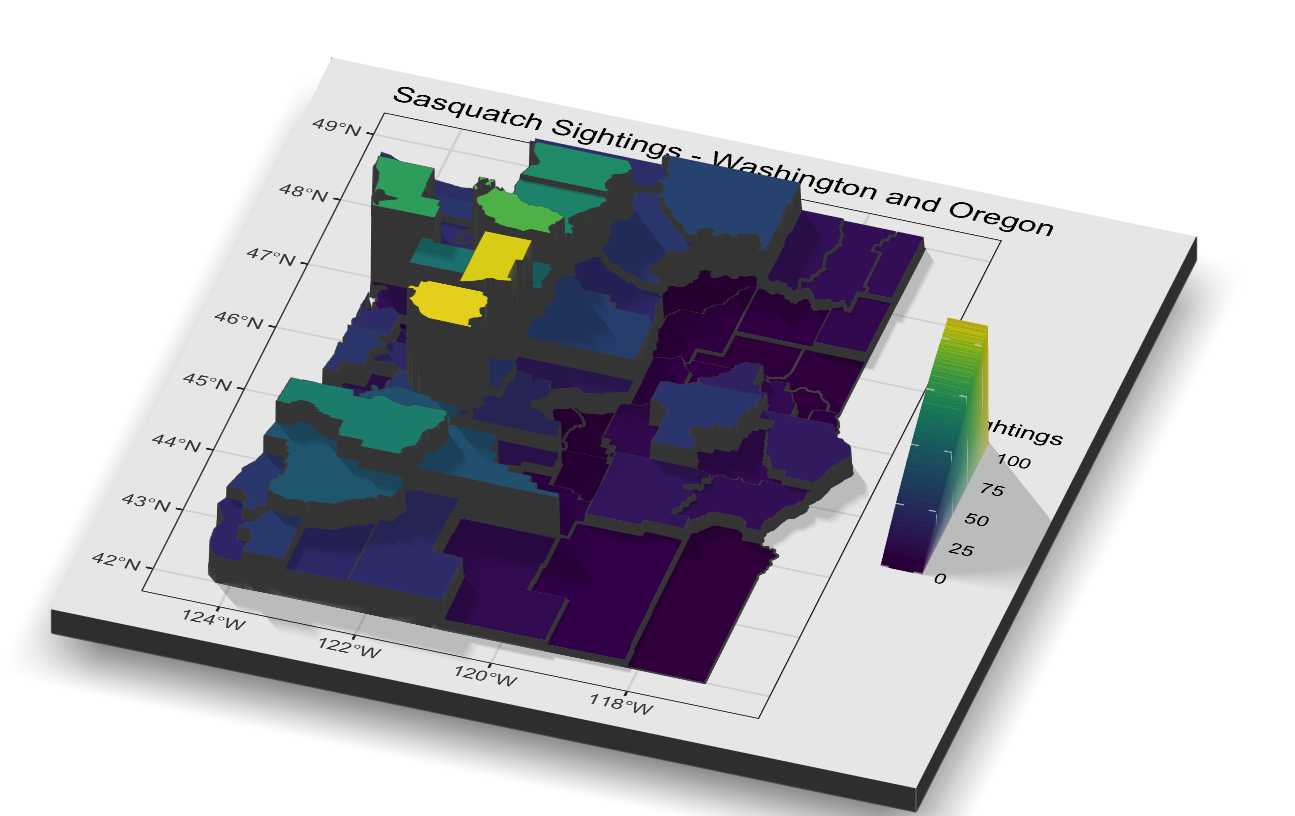
3D Mapping of Sasquatch Sightings in R with Rayshader
Prior articles in this series Introduction to GIS Analysis using Sasquatch SightingsSpatial Squatch – Using the ArcGIS Pro Spatial Statistics Toolbox to Identify Sighting PatternsMapping Clusters of Sasquatch SightingsSasquatch Sighting Heat Maps with R In this...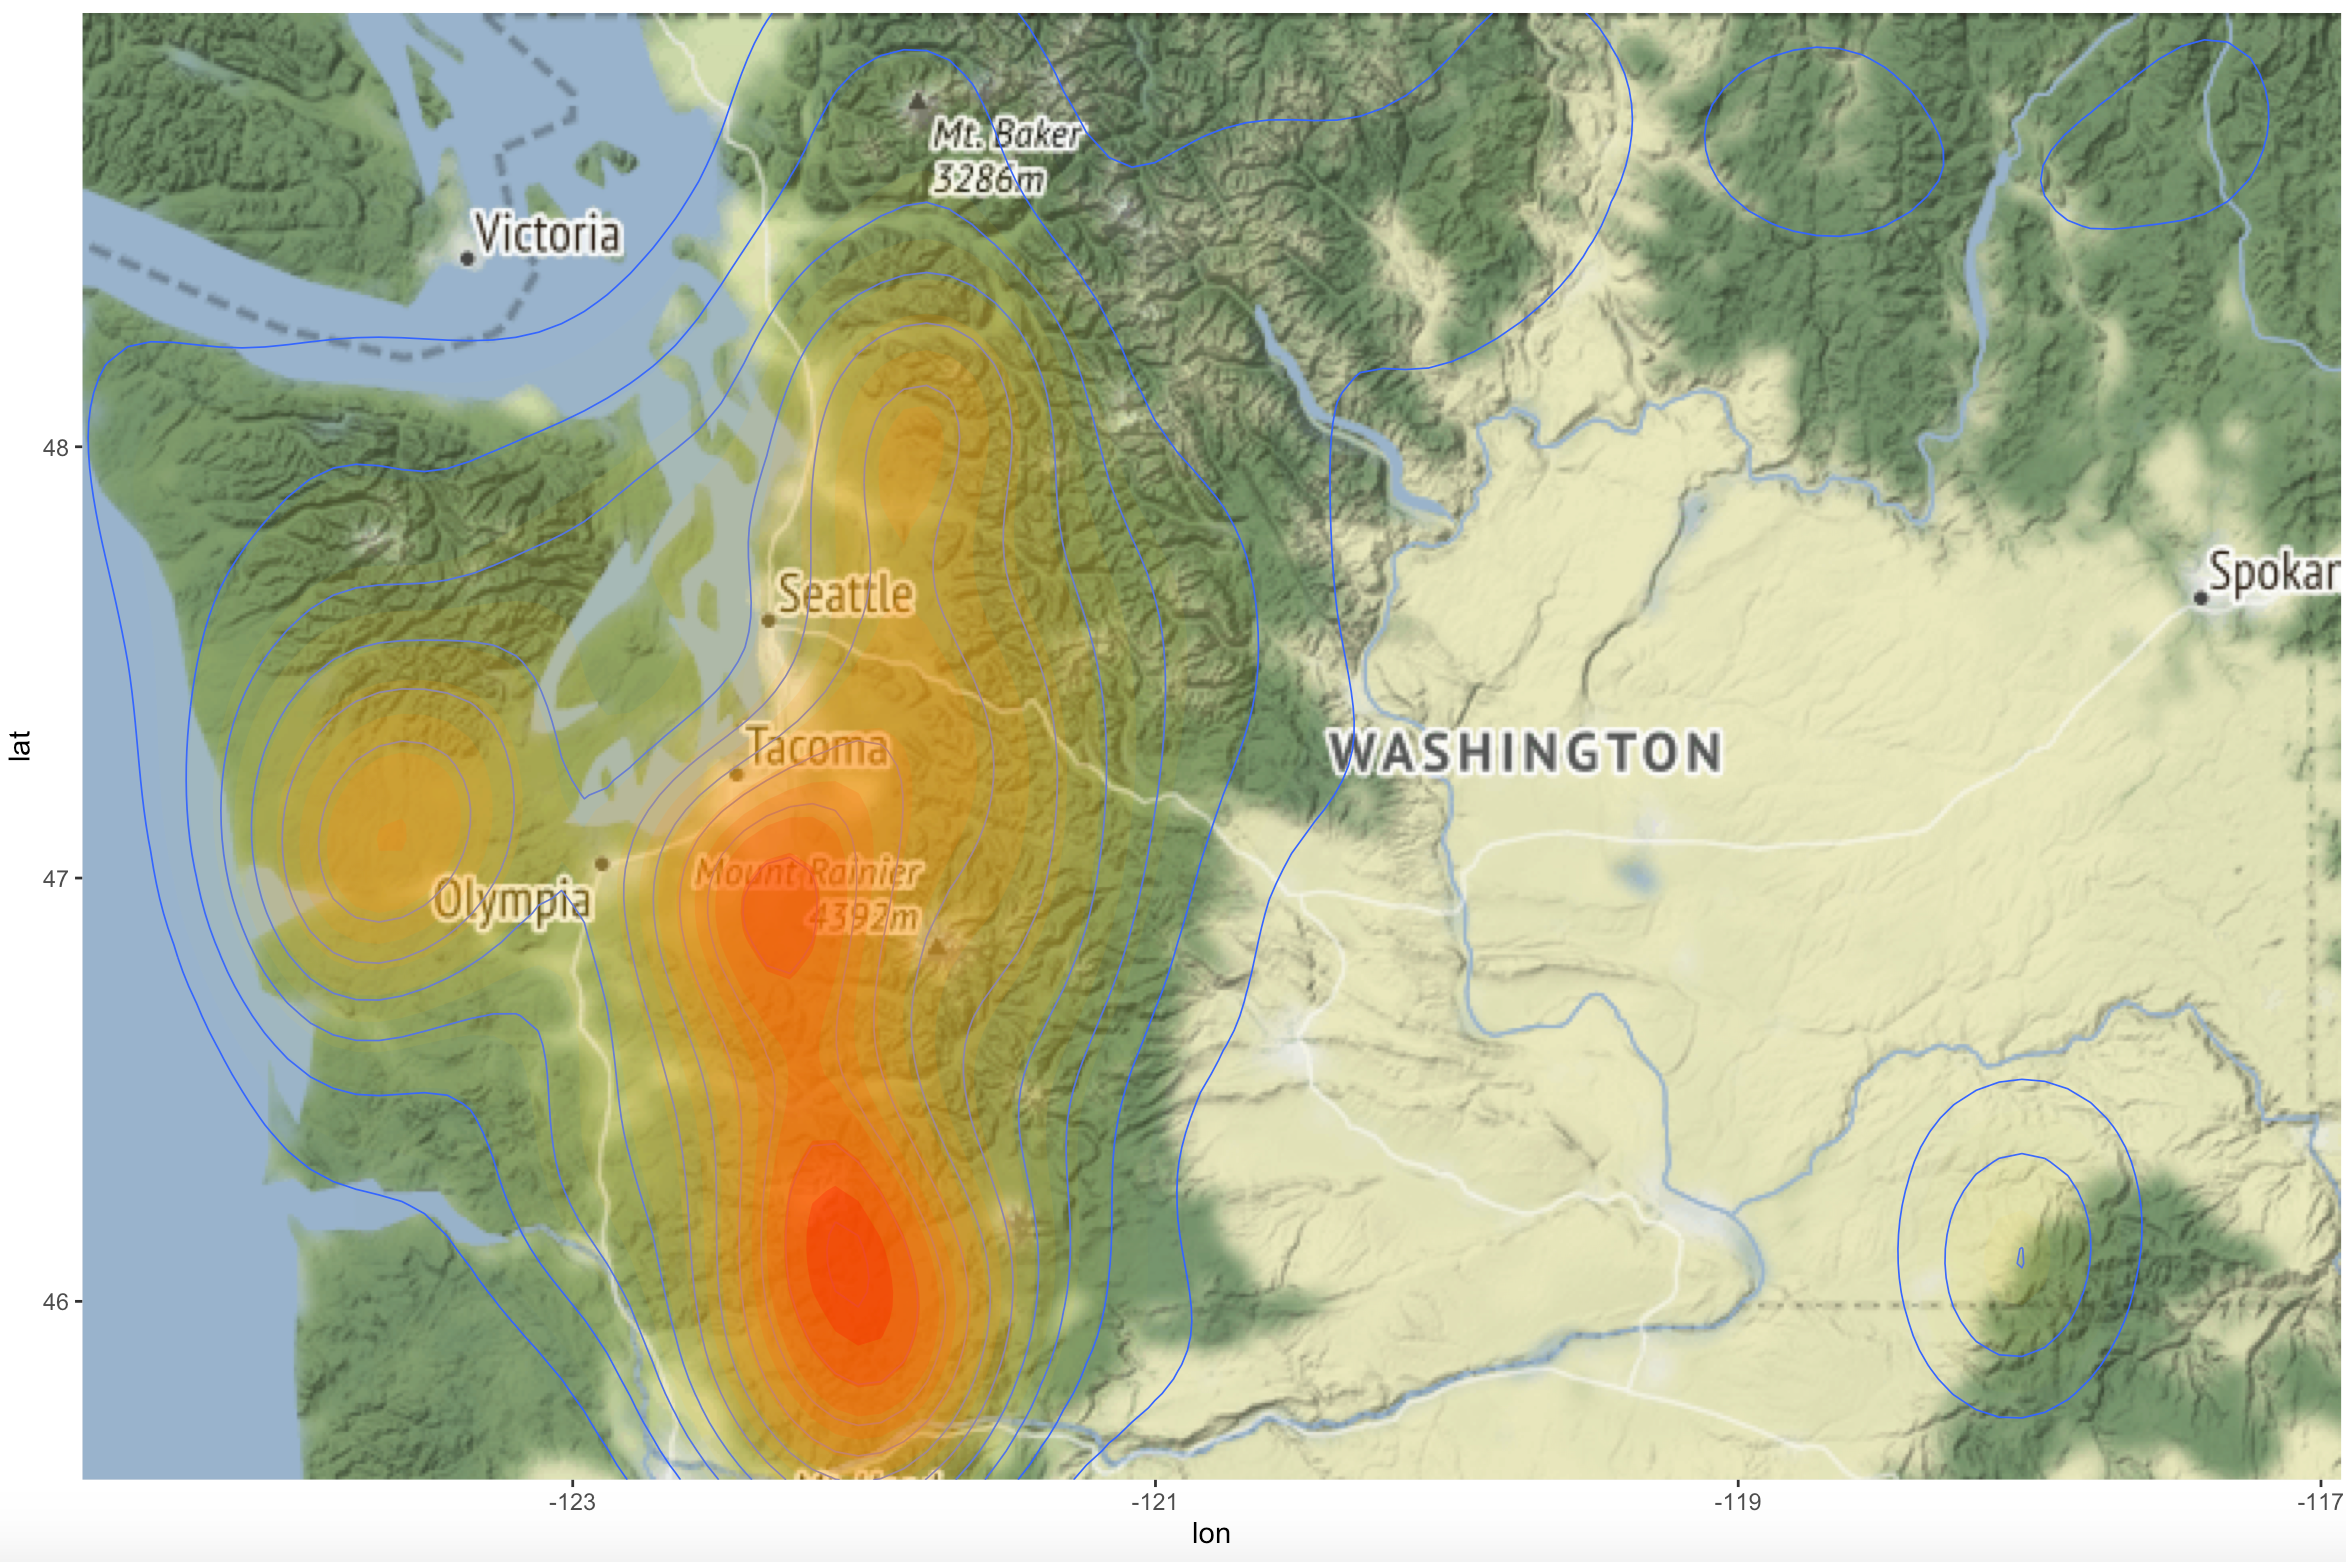
Sasquatch Sighting Heat Maps with R
Prior articles in this series Introduction to GIS Analysis using Sasquatch SightingsSpatial Squatch – Using the ArcGIS Pro Spatial Statistics Toolbox to Identify Sighting PatternsMapping Clusters of Sasquatch Sightings In this article I’ll deviate a little from...
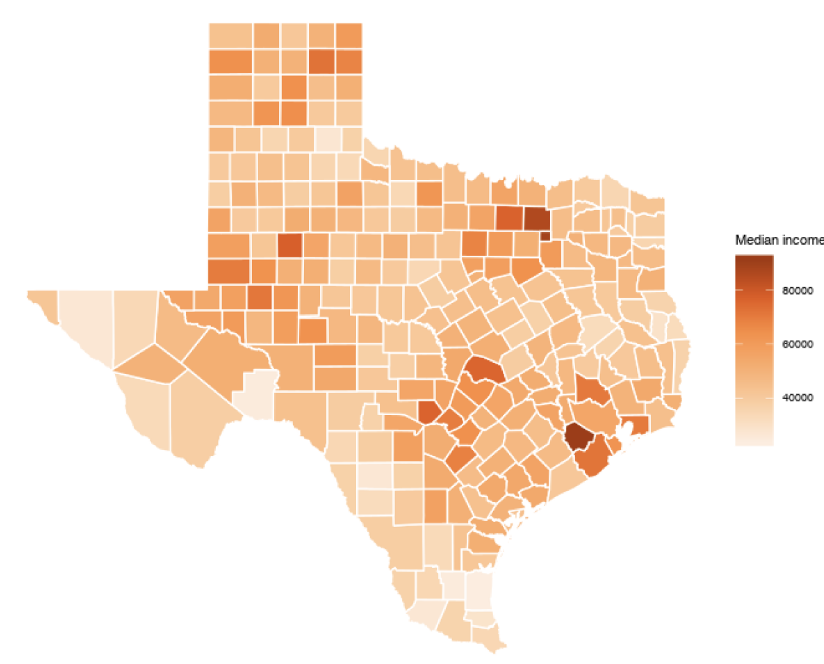
Automating Census Map Production with R
Many of our readers regularly work with U.S. Census data for mapping and analysis purposes. Whether you work with these datasets every day or just every now and then to create a simple map you’ve no doubt discovered how difficult it can be to decipher census...