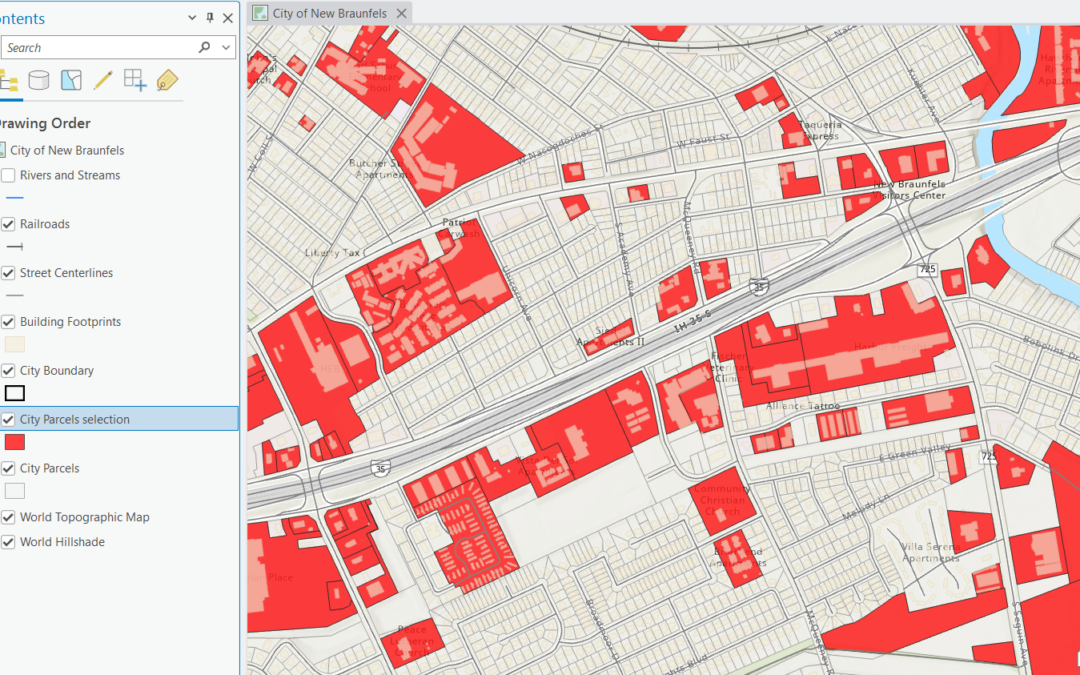
Mastering Selection Layers in ArcGIS Pro: A Powerful Tool for GIS Analysis
Our annual Spring Sale is underway! Save 20% on any of our classes through May 31st by using the discount code springsale when checking out online. Selection layers are one of the most versatile yet sometimes overlooked features in ArcGIS Pro. Whether you’re a...
Elevate Your GIS Skills This Spring – 20% Off All Training Courses
Spring is the perfect time for growth and renewal, and that includes your GIS career! For a limited time, we’re offering our ANNUAL SPRING SALE with 20% off all GIS training courses. Whether you’re looking to master ArcGIS Pro, enhance your spatial...
The Future of GIS Work in the Age of AI: Evolution, Transformation, and Potential Displacement
The rise of artificial intelligence (AI) in Geographic Information Systems (GIS) is transforming the way geospatial data is analyzed and applied, particularly in government agencies. From local municipalities to federal departments, AI is streamlining processes,...
Mastering Feature Blending in ArcGIS Pro: Create Stunning Maps with Advanced Visualization Techniques
Creating beautiful, informative maps in ArcGIS Pro requires more than just stacking layers and applying basic symbology. To truly elevate your cartography, you need to understand how features can interact visually within a single layer. Enter Feature Blending—a...