Understanding GIS Data Formats in ArcGIS Pro: A Comprehensive Guide
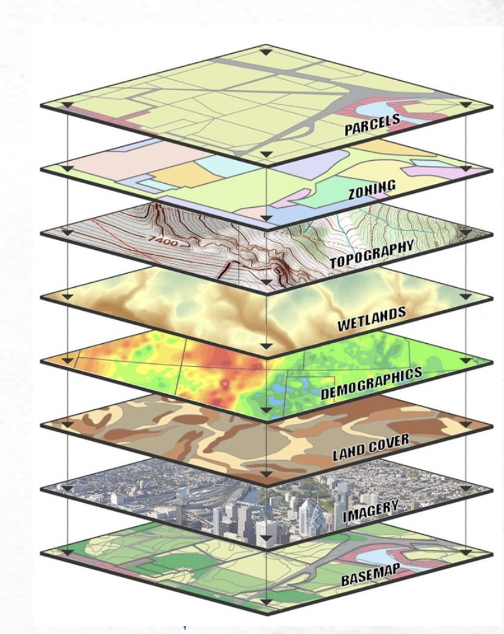
GIS data comes in many shapes and formats, and ArcGIS Pro supports a wide variety of data formats that can be used as sources for layers in your mapping projects. While ArcGIS Pro works with numerous formats, geodatabases represent the cornerstone of efficient data...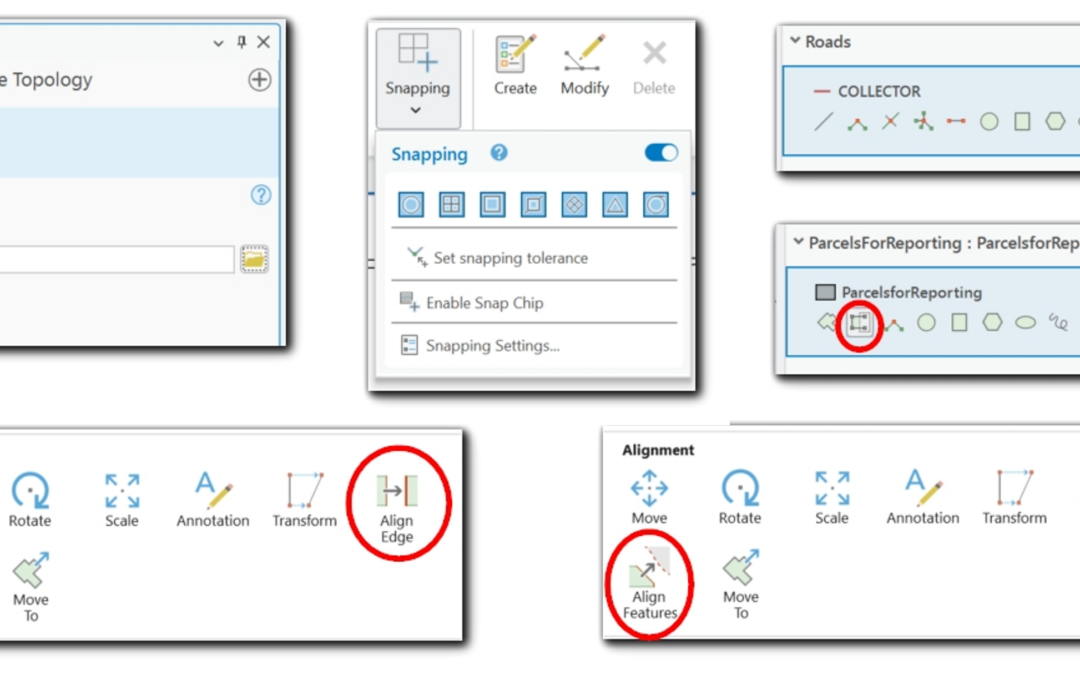
Tips and Tricks for Creating Adjacent Polygons Without Gaps or Overlaps in ArcGIS Pro
Save 20% on our GIS training through May 31st by using the discount code springsale when checking out. Why Topological Accuracy Matters In GIS, adjacent polygons must meet seamlessly to support reliable spatial analysis. Gaps or overlaps between features can lead to...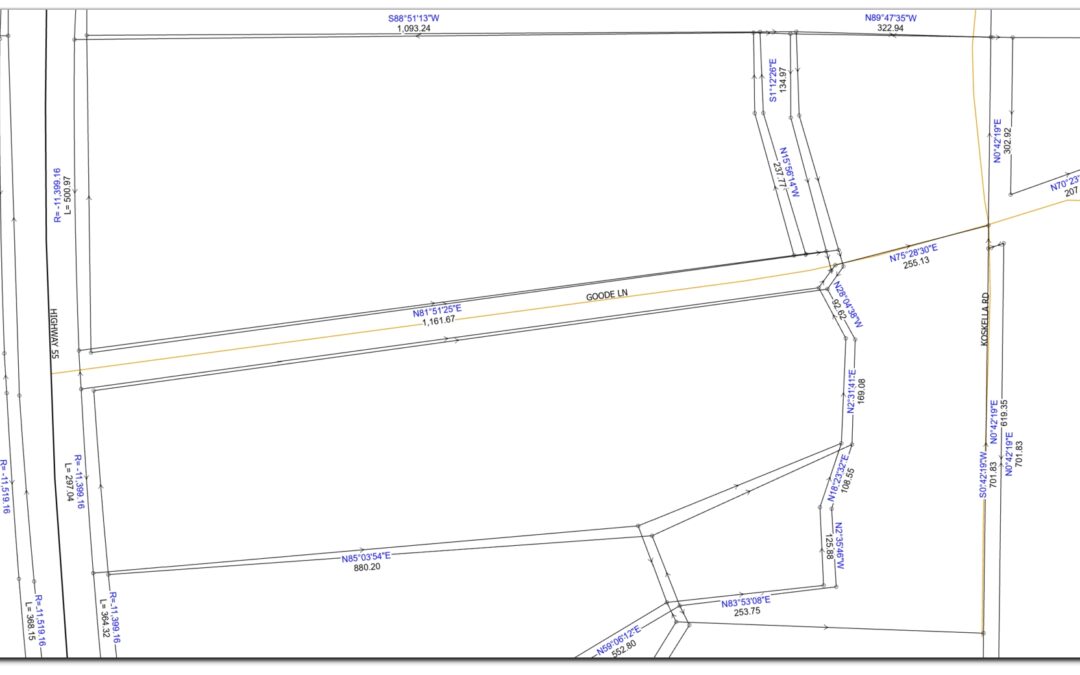
COGO vs. Parcel Fabric: Defining Boundaries with Precision and Structure
In cadastral GIS, the accuracy and integrity of parcel boundaries are crucial for land management, taxation, and development. Two core concepts, COGO (Coordinate Geometry) and Parcel Fabric, help GIS professionals ensure that parcel data is both precisely measured and...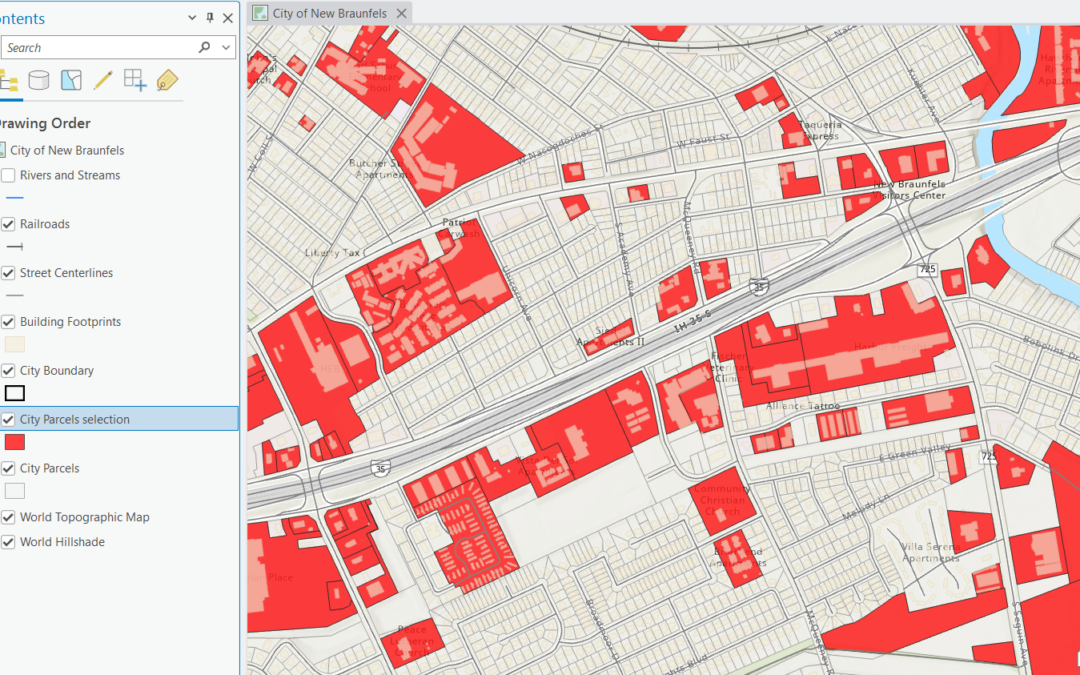
Mastering Selection Layers in ArcGIS Pro: A Powerful Tool for GIS Analysis
Our annual Spring Sale is underway! Save 20% on any of our classes through May 31st by using the discount code springsale when checking out online. Selection layers are one of the most versatile yet sometimes overlooked features in ArcGIS Pro. Whether you’re a...