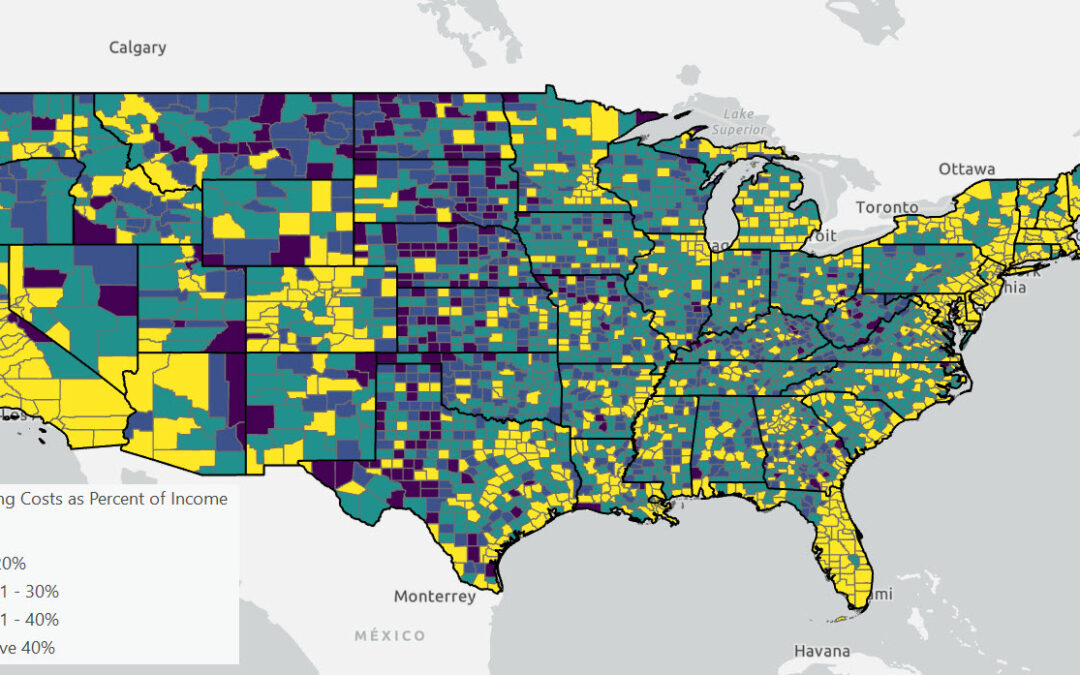
From Bad to Worse: The Escalating Cost Burden on American Renters
In 2022, according to the latest U.S. Census Bureau data, 44% of American renters allocated 30% or more of their income to housing costs, with 23% spending at least half of their income on housing. This level of expenditure classifies them as “cost...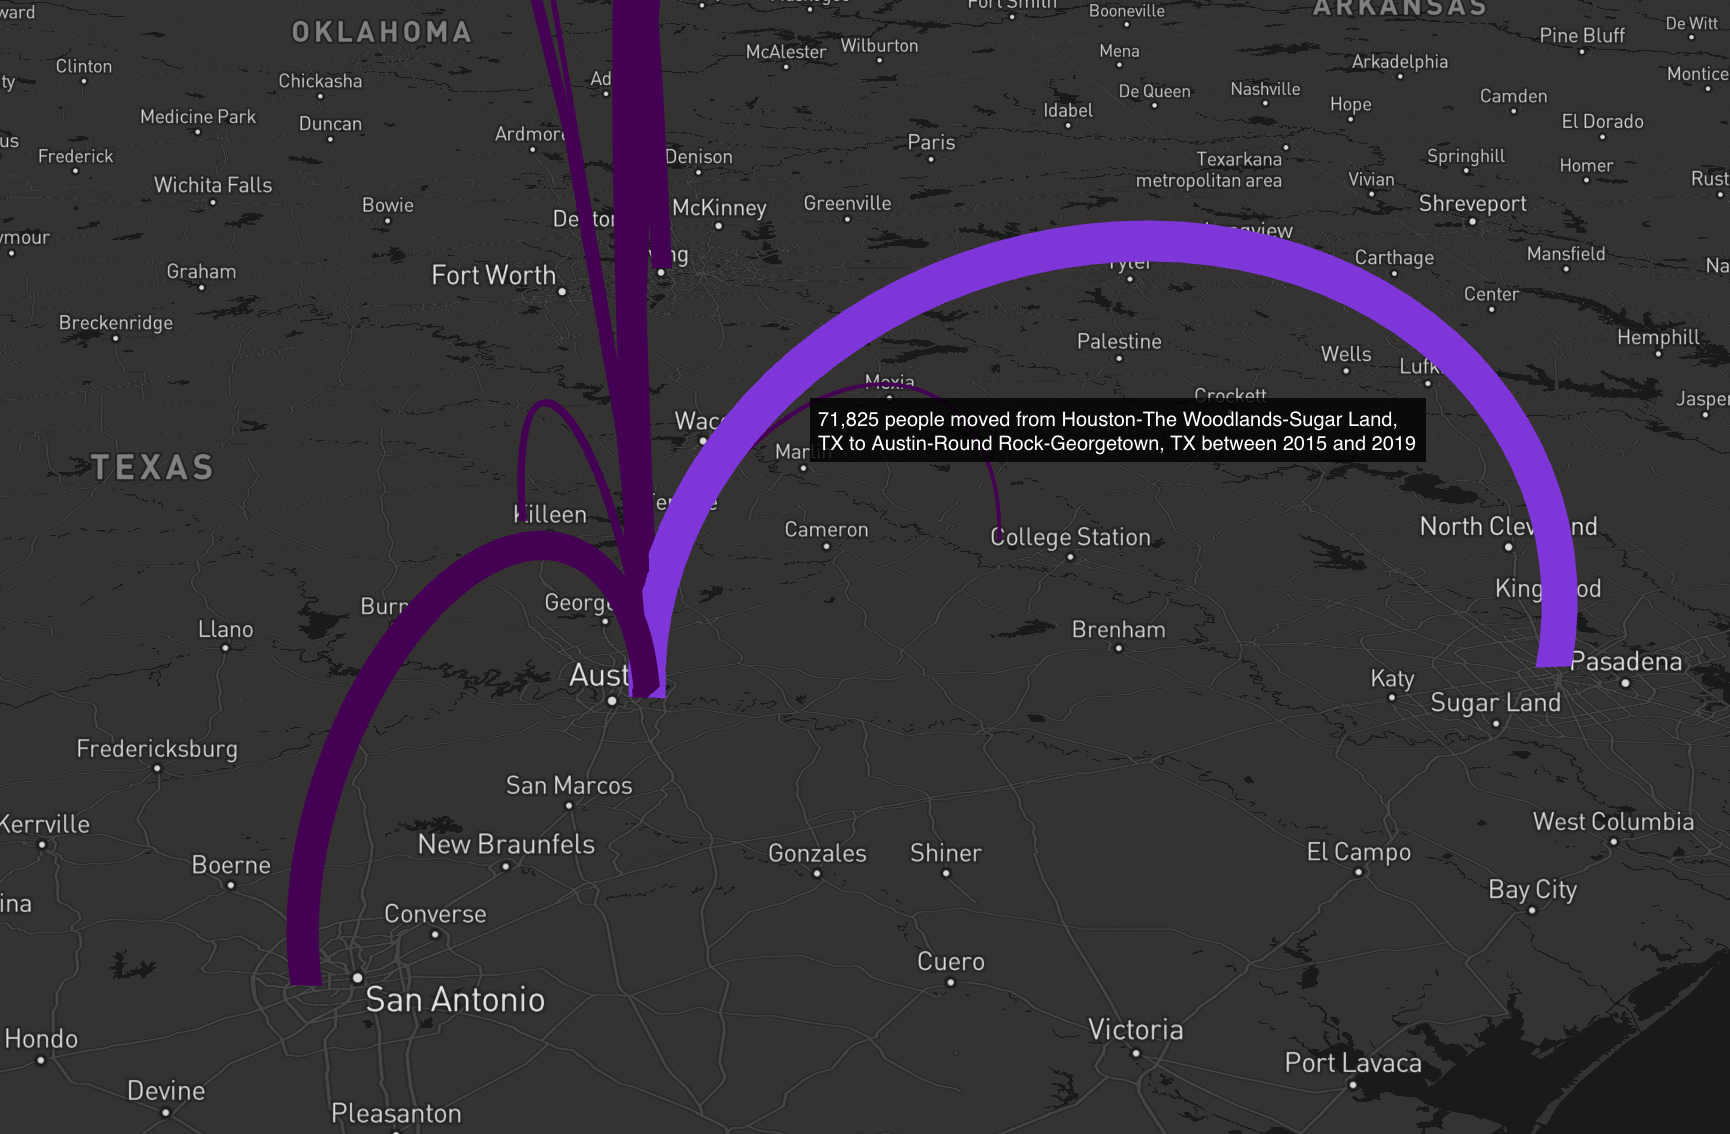
Tutorial: Mapping Migration Flows with R
The American Community Survey Migration Flows dataset estimates the number of people that have moved between pairs of places. The estimates are calculated based on where a person lived when surveyed and where they lived one year prior to being surveyed. The data is...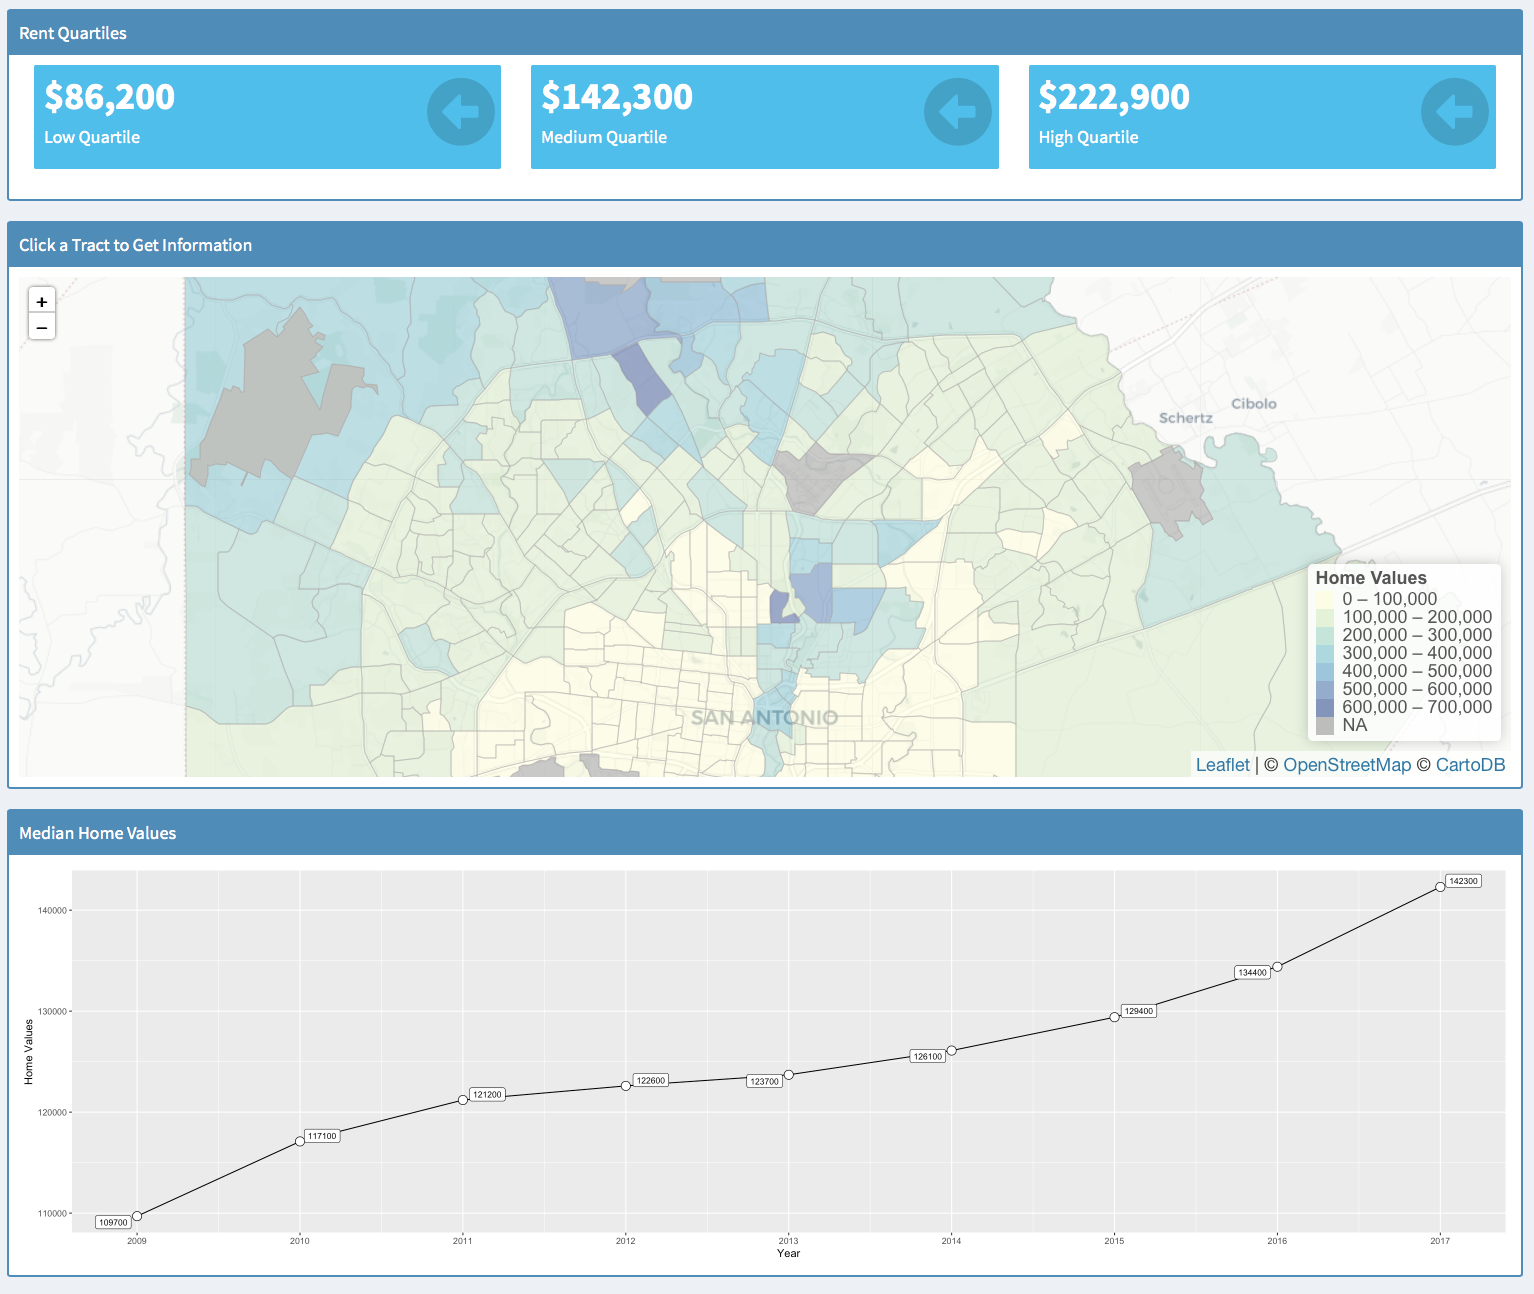
New Book Coming Soon – Exploring and Visualizing US Census Data with R
This November (2019) my new book – Exploring and Visualizing US Census Data with R will be published. You can get a free copy of the digital version of this book simply by entering your email address. The book will be delivered to your email inbox no later than...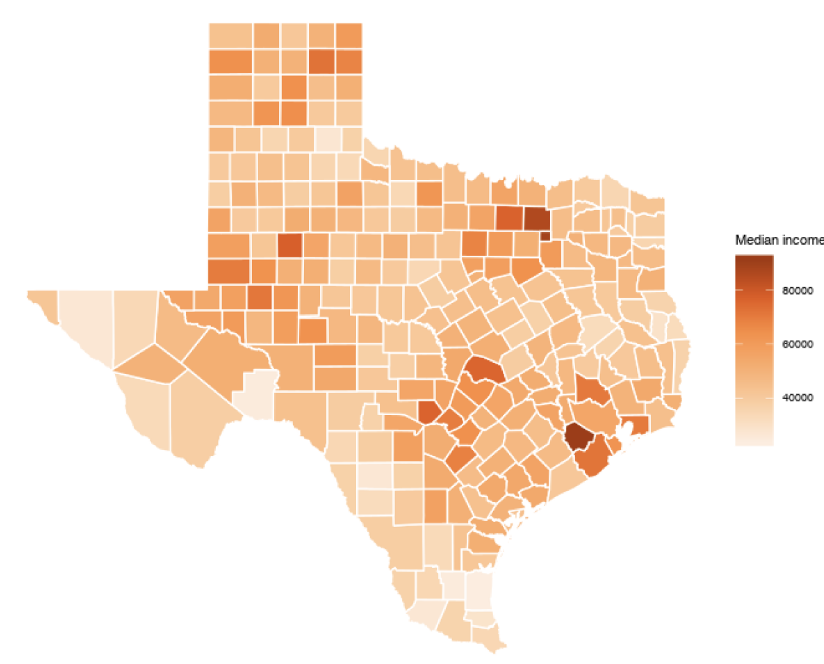
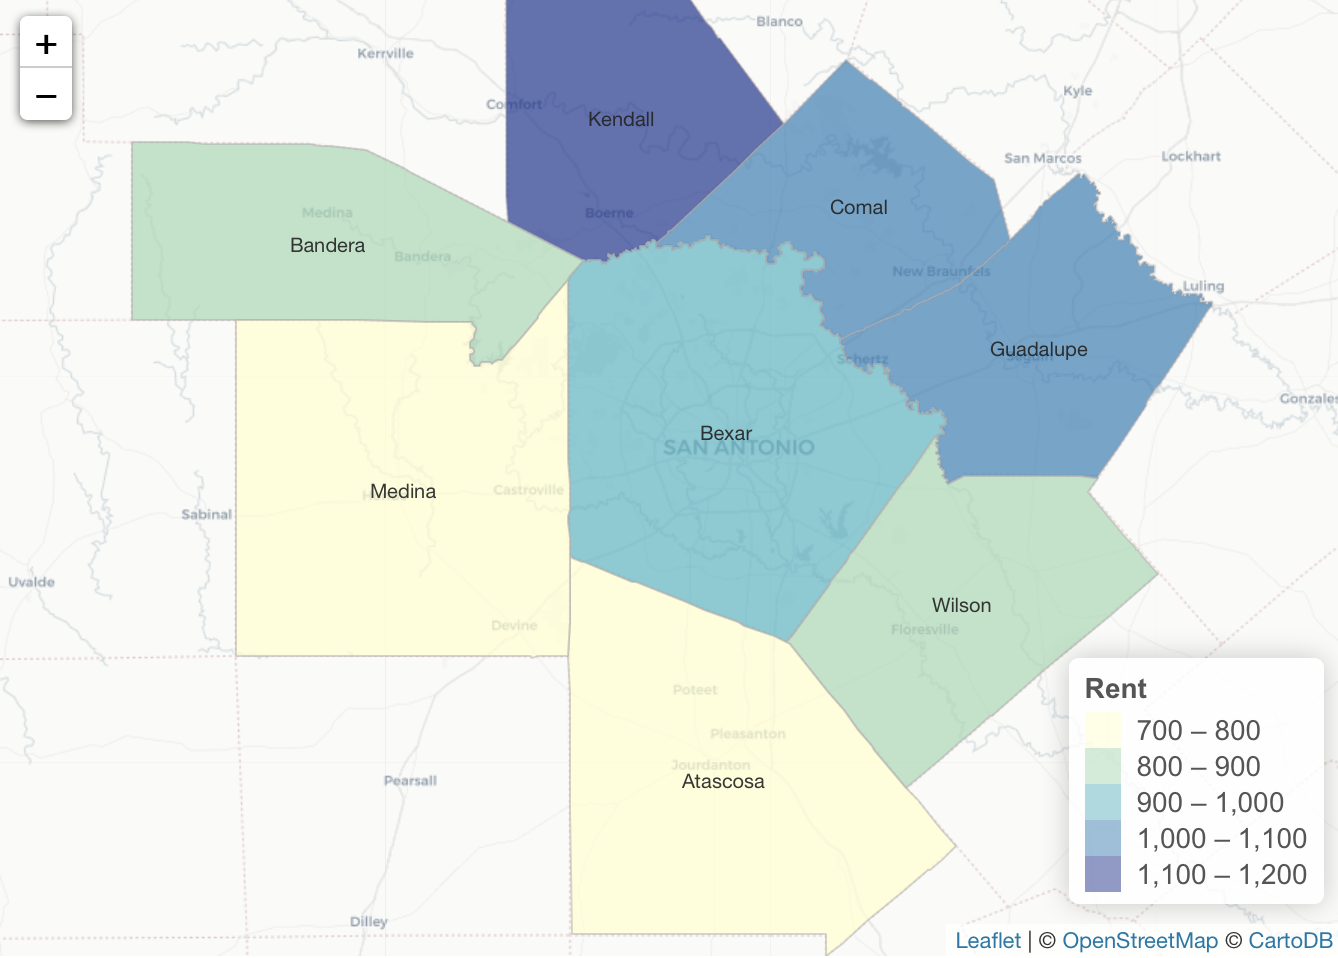
Exporting Census Data to Shapefiles with R
In a previous article you were introduced to using US Census data using the tidycensus R package. In that article you learned how easy it is to generate R datasets containing either decennial or American Community Survey (ACS) data and visualize that information as...