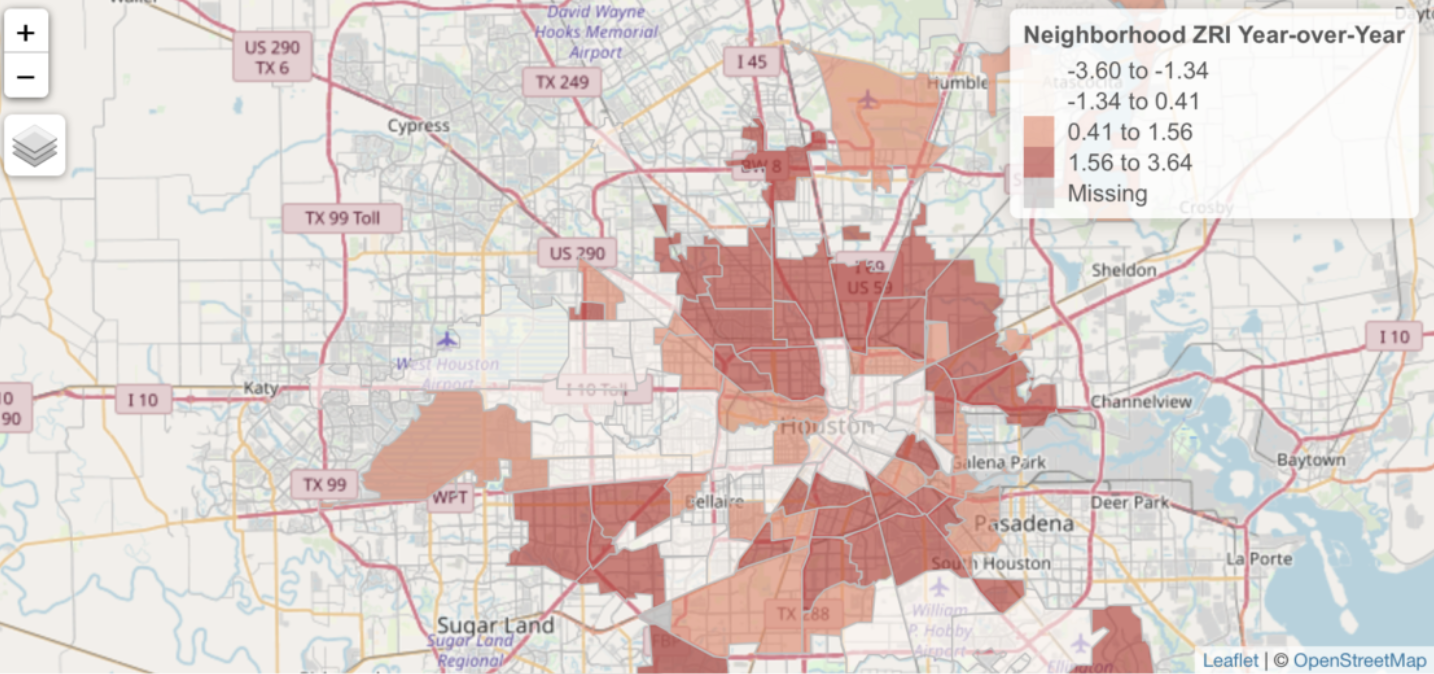
Zillow Local Market Rental Overview Application
Head over to our sister site – Location3x – and check out a sample application that we built with Shiny and R. The Zillow Market Overview: Rentals application is a dynamic web application that illustrates the visualization capabilities provided by the...
Editing Data in ArcGIS Pro – Using basic distance and direction tools to create line segments
This video demonstrates how to create simple line segments at specific distances and directions while editing data in ArcGIS Pro. Upcoming ArcGIS Pro Classes Learning ArcGIS Pro 1: Maps and Projects Learning ArcGIS Pro 2: Editing, Analysis, and Automation Learning...
Save 15% on Annual GIS Training During February 2019
During the month of February you can save 15% on any Annual GIS Training License. Our Annual GIS Training License gives organizations of all sizes 24×7 access to 40 of our self-paced online GIS training classes. The Annual GIS Training License is available for...
ArcGIS Pro 2.3 Released – What’s New?
Esri just released an update for ArcGIS Pro. This new version, 2.3, contains a wealth of improvements, I think you will like. Just to mention a few: Now you can open a new blank project without a template. This means all those project files that normally are created...