New Book – Data Visualization and Exploration with R
My new book, Data Visualization and Exploration with R, is scheduled for publication on September 20th, 2018. Our newest class, Introduction to R for Data Visualization (Charts, Graphs, and Maps), is also based on this book. You can pre-order a digital version of the...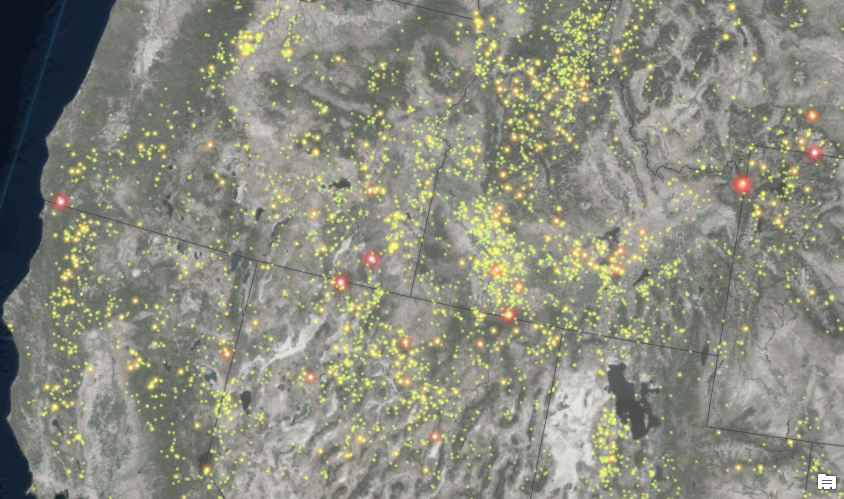
Using the ArcGIS Pro Firefly Style for Data Visualization
Esri recently released a new visualization style and supporting basemap for ArcGIS Pro that you’re going to want to check out. The new Firefly style and supporting basemap can be used to create really attractive thematic visualizations. In this article...Video – Comparing ArcGIS Pro and ArcGIS Desktop
This video from Tripp Corbin compares the two Esri desktop GIS applications. Upcoming ArcGIS Pro classes: Learning ArcGIS Pro 1: Maps and Projects Learning ArcGIS Pro 2: Editing, Analysis, and Automation Learning ArcGIS Pro 3: Converting, Linking, and...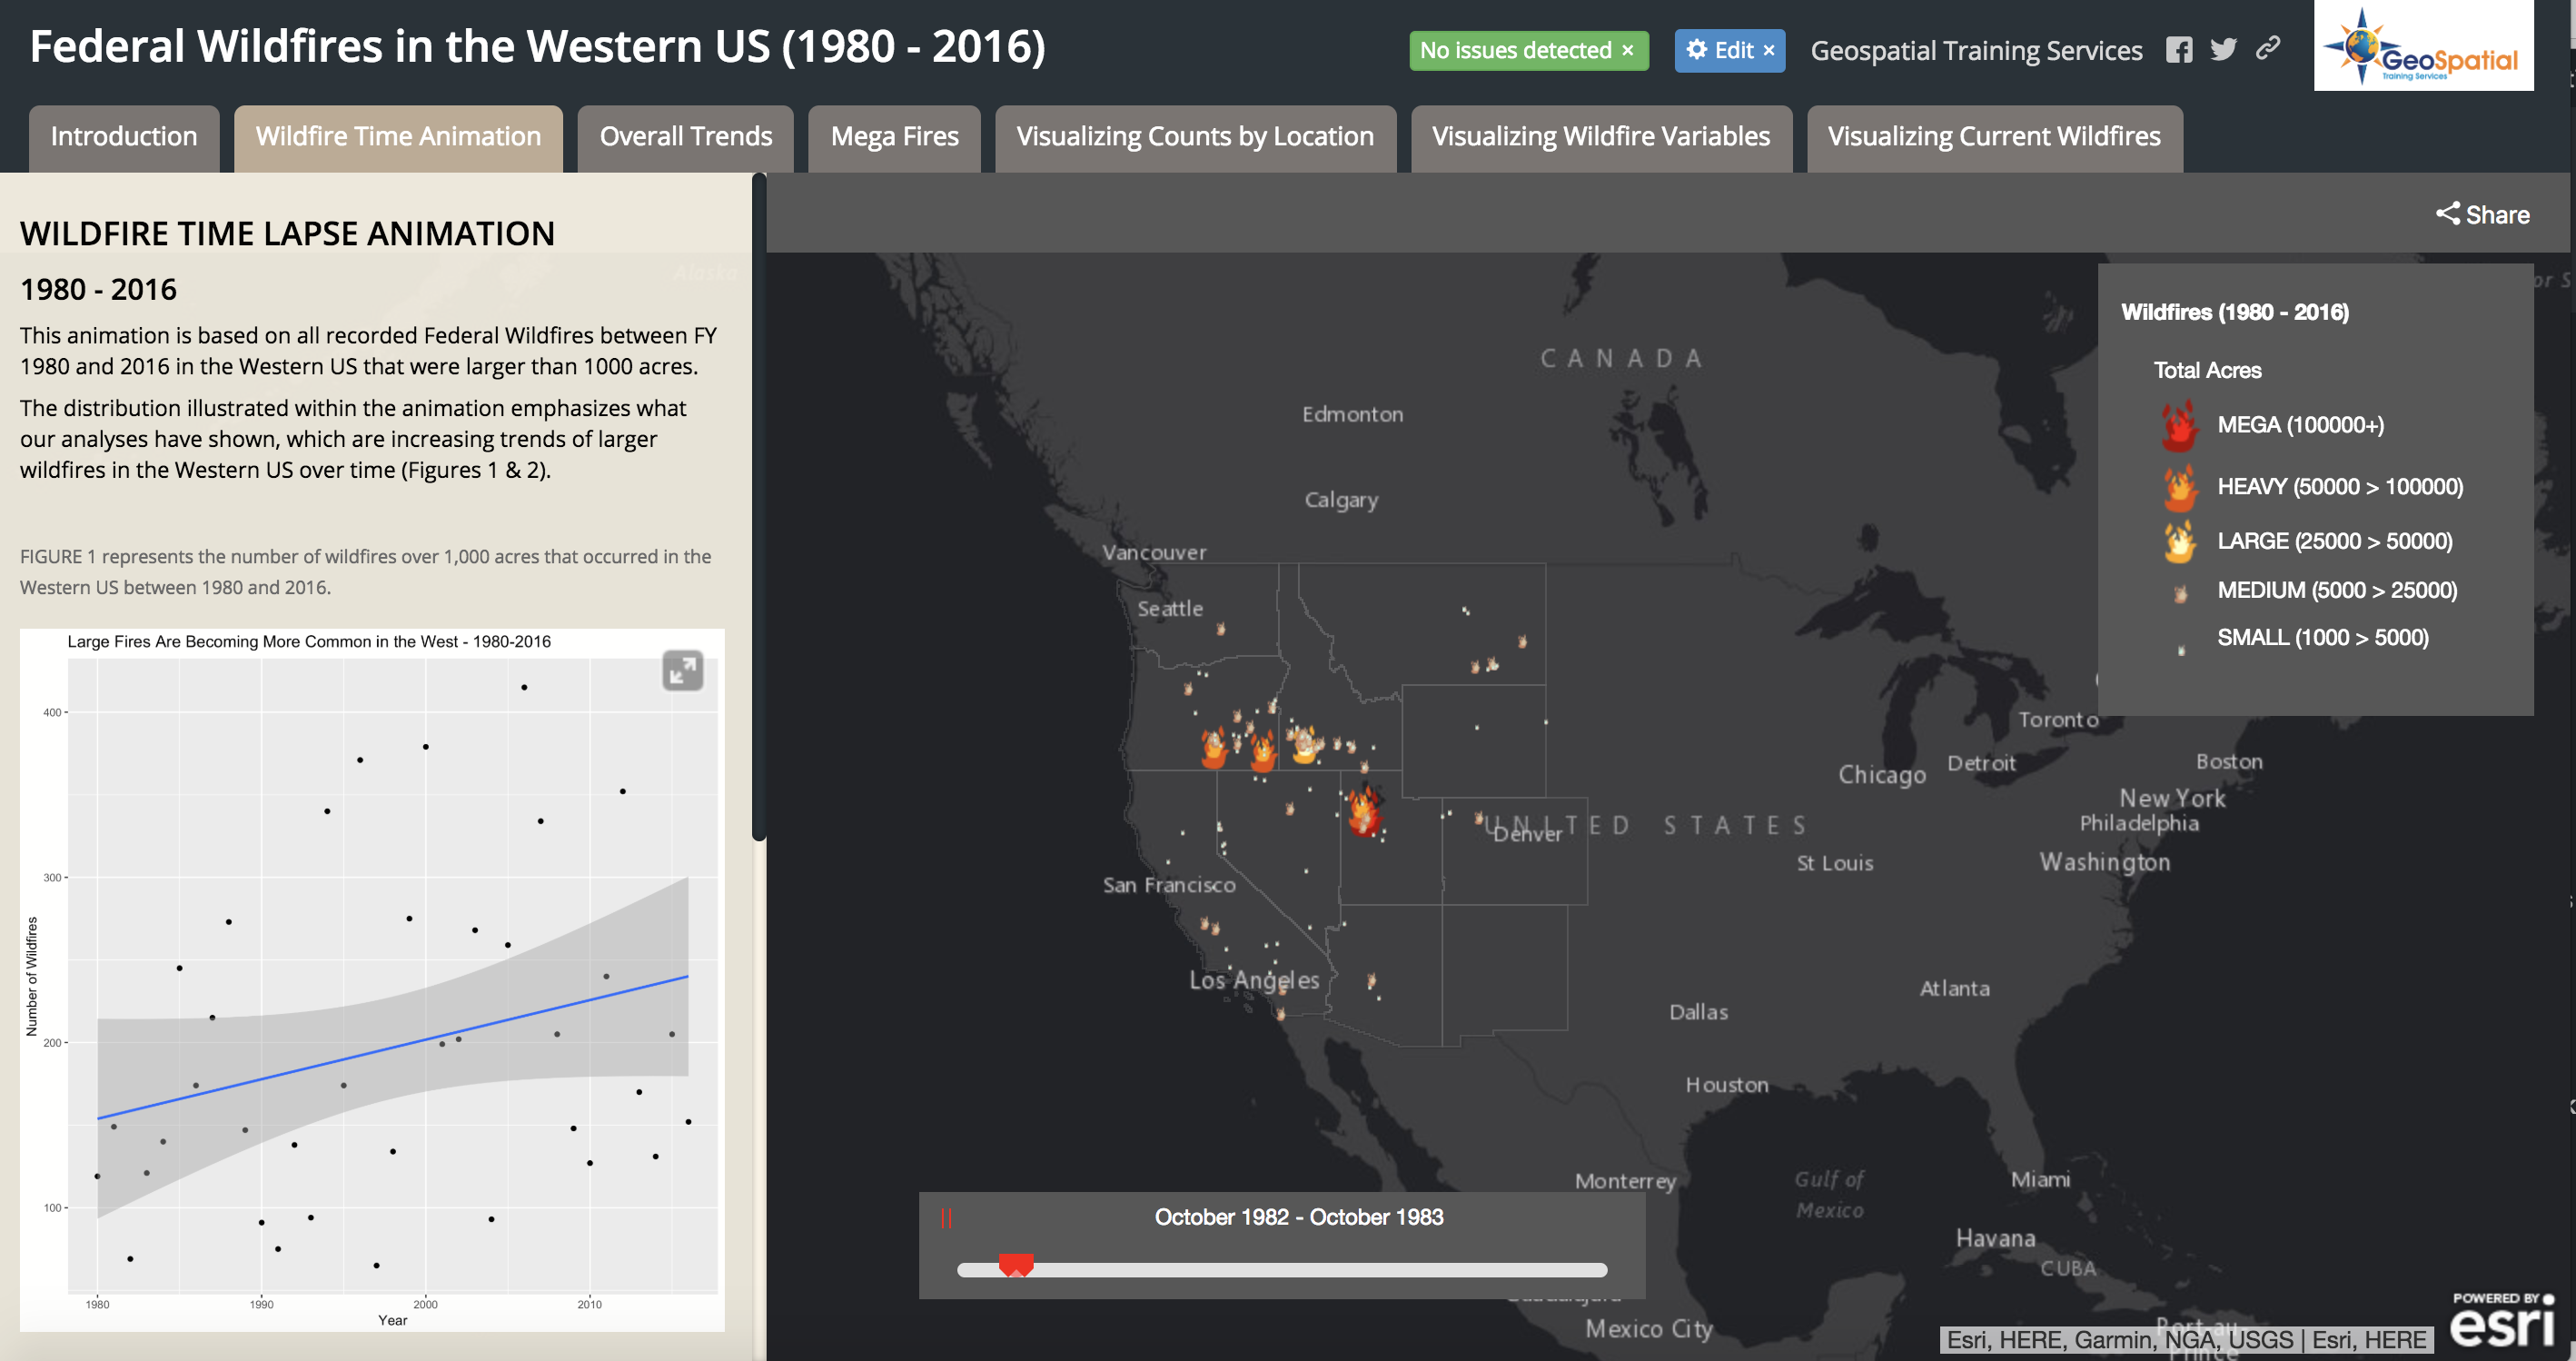
Visualizing Historical Wildfire Information in a Story Map
The 2017 wildfire season shattered records and cost the U.S. Forest Service an unprecedented $2 billion. From the Oregon wildfires to late season fires in Montana, and the highly unusual timing of the California fires in December, it was a busy year in the Western...