ArcPy doesn´t have an option to export shapefile attribute tables to pandas DataFrame objects. Fortunately, there are number of workarounds available to make this happen.
Pandas DataFrame objects are comparable to Excel spreadsheet or a relational database table. They come from the R programming language and are the most important data object in the Python pandas library. They are handy for data manipulation and analysis, which is why you might want to convert a shapefile attribute table into a pandas DataFrame. Unfortunately, ArcMap offers no such functionality and pandas itself doesn´t know what to do with spatial data. However, there are various workarounds available to create DataFrame objects from shapefiles attribute tables. A few of them are covered below.
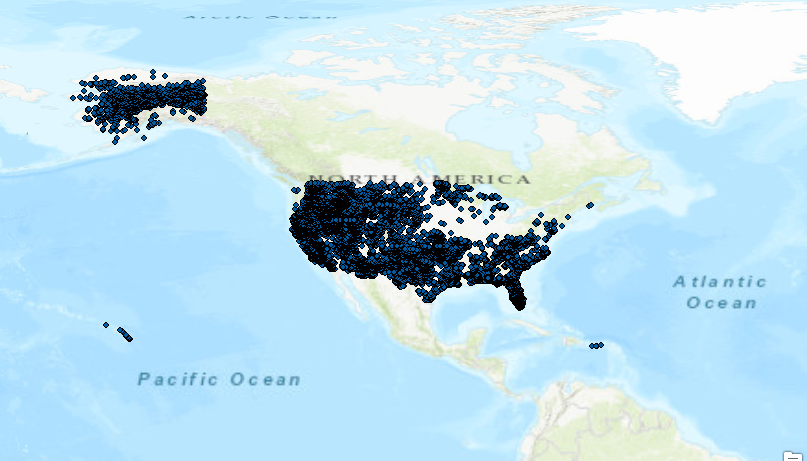
To follow the instructions below, you can download the MTBS wildfire data (national datasets) and store them on your pc. The file that will be analyzed here is the mtbs_fod_pts_20170501 shapefile’s attribute table, that counts 20,340 rows and 30 columns.
Option 1: convert a shapefile’s attribute table to an Excel table
If you have ArcMap available, head over to the System Toolboxes in ArcCatalog and choose “Conversion Tools” -> “Excel” -> “Table to Excel”. Choose an input file, name the Excel file that will be created and mark the “use field alias as column header” box. The same can be done using arcpy as follows:
import arcpy
# Set local variables
in_table = “C:\data\mtbs_fod_pts_data\mtbs_fod_pts_20170501.dbf”
out_xls = “excel_table.xls”
# Execute TableToExcel
arcpy.TableToExcel_conversion(in_table, out_xls)
The resulting 8+ megabyte Excel file can be imported as a pandas DataFrame as follows:
import pandas as pd
df = pd.read_excel(“C:\data\mtbs_fod_pts_data\excel_table.xls”)
df(head) # this will print out the first 5 rows and corresponding columns
df.shape #this will print out a list with the total amount of rows and columns.
Option 2: use Arcpy to convert a Numpy Array to a pandas DataFrame
The second option uses arcpy functionality to create NumPy arrays from attribute tables. The following code converts a pandas DataFrame from an NumPy array with attribute table data:
import arcpy
import pandas as pd
input = “C:\data\mtbs_fod_pts_data\mtbs_fod_pts_20170501.shp”
arr = arcpy.da.TableToNumPyArray(input, (‘FIRE_ID’, ‘FIRENAME’))
df = pd.DataFrame(arr)
As you can see, only two columns are used for the creation this DataFrame, as selecting all columns will give an memory allocation error. In other words, this solution is not scalable. However, this solution can come in handy when you only want a subset of the data returned as pandas DataFrame.
A similar, but more efficient approach uses Search Cursors to select the columns of interest:
df_2 = pd.DataFrame(arcpy.da.FeatureClassToNumPyArray(input,
[‘FIRE_ID’, ‘FIRENAME’],
skip_nulls=False,
null_value=-99999))
Option 3: Use The GeoPandas Library´s to Create a GeoPandas DataFrame
The quickest and easiest option to create a DataFrame from a shapefile is by using GeoPandas, a Python library for working with geospatial data. GeoPandas inherits the standard pandas methods for indexing and selecting data and adds geographical operations as spatial joins and merges. Geopandas can read almost any vector-based spatial data format, including Esri shapefile so that with only two lines of code, you can place all rows and columns into a GeoDataFrame, the library´s data object that is modeled after the pandas DataFrame. This GeoDataFrame also lists a Geometry column containing points for each row (feature):
import geopandas
gdf = geopandas.read_file(“C:\data\mtbs_fod_pts_data\mtbs_fod_pts_20170501.shp”)

