The Determinism Gap: Why AI Doesn’t Replace GIS Automation
A planner sits down with ChatGPT and asks for help finding suitable parcels for a new fire station. They paste in a description of the criteria — inside the city limits, outside the floodplain, at least two acres, within half a mile of a major road. The model returns...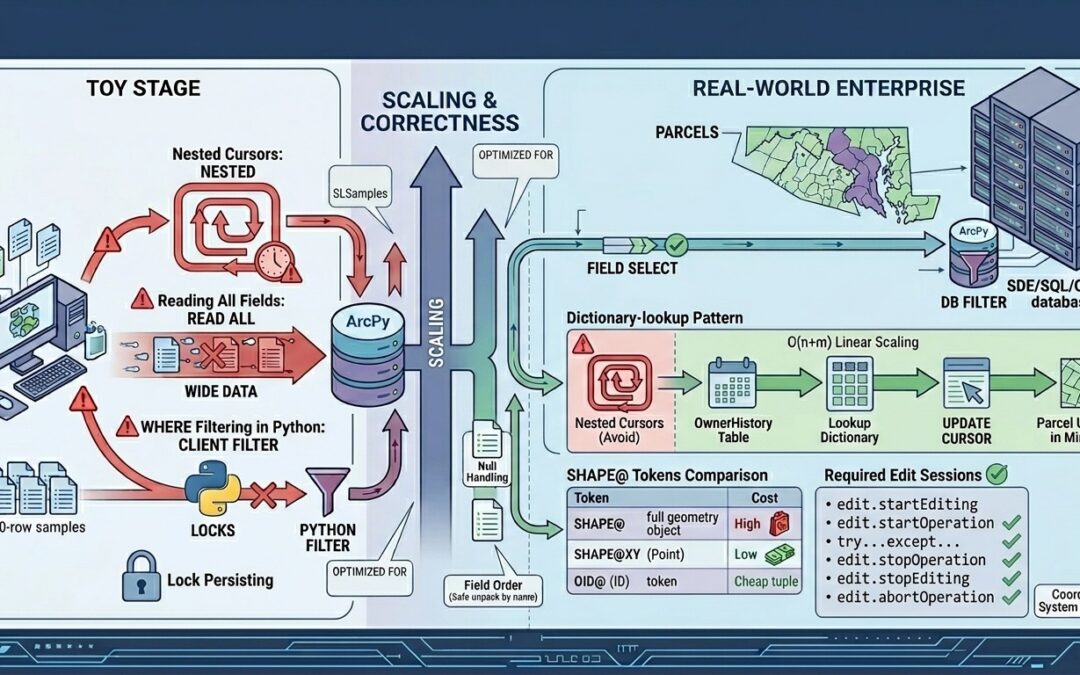
ArcPy Cursors That Scale: Patterns for Real-World Geodatabases
In the last article we built a script that inventories everything inside a geodatabase: feature classes, tables, fields, domains, subtypes, and relationship classes. Knowing what’s in there is the first step. The second is being able to read and write all that...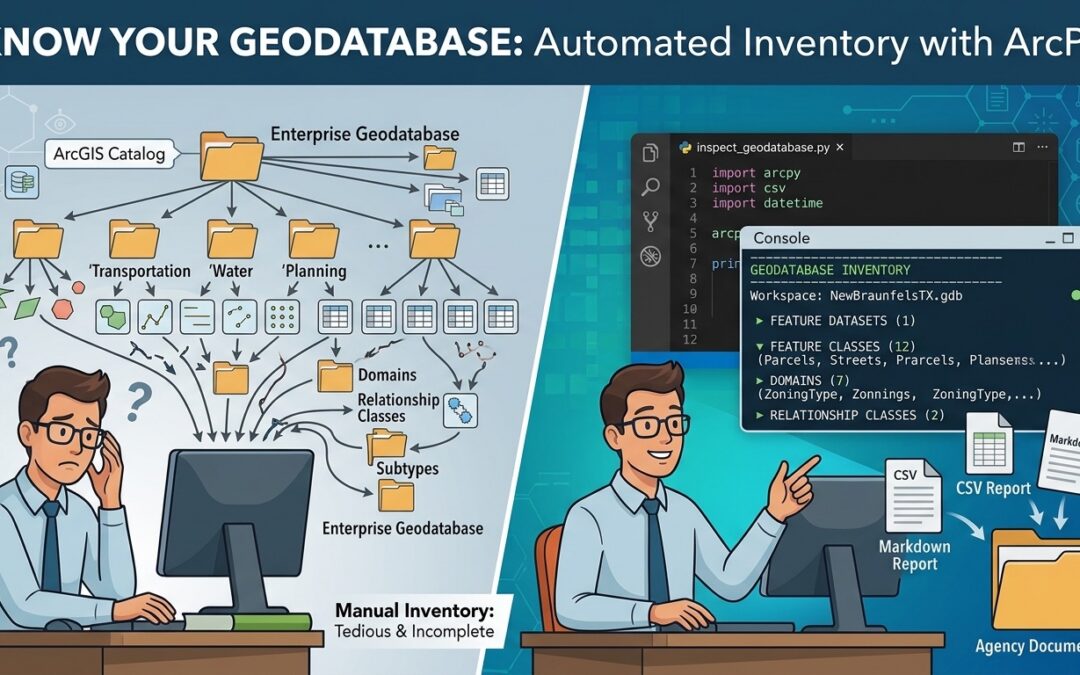
Know Your Geodatabase: A Reusable ArcPy Inspection Script
You’ve been here before. A vendor delivers a file geodatabase as part of a contracted project and you need to verify what they built before signing off. Your predecessor leaves the agency and you inherit an enterprise geodatabase connection and a folder of...
Survey of AI Tools Across the ArcGIS Platform
Esri has been steadily weaving artificial intelligence into the fabric of the ArcGIS platform. What started over a decade ago with machine learning tools for clustering and classification has evolved into a comprehensive ecosystem spanning deep learning, natural...