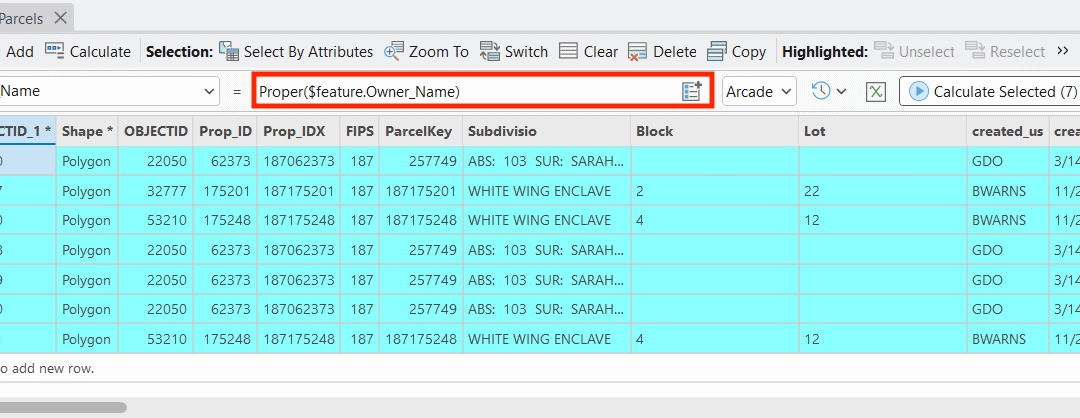
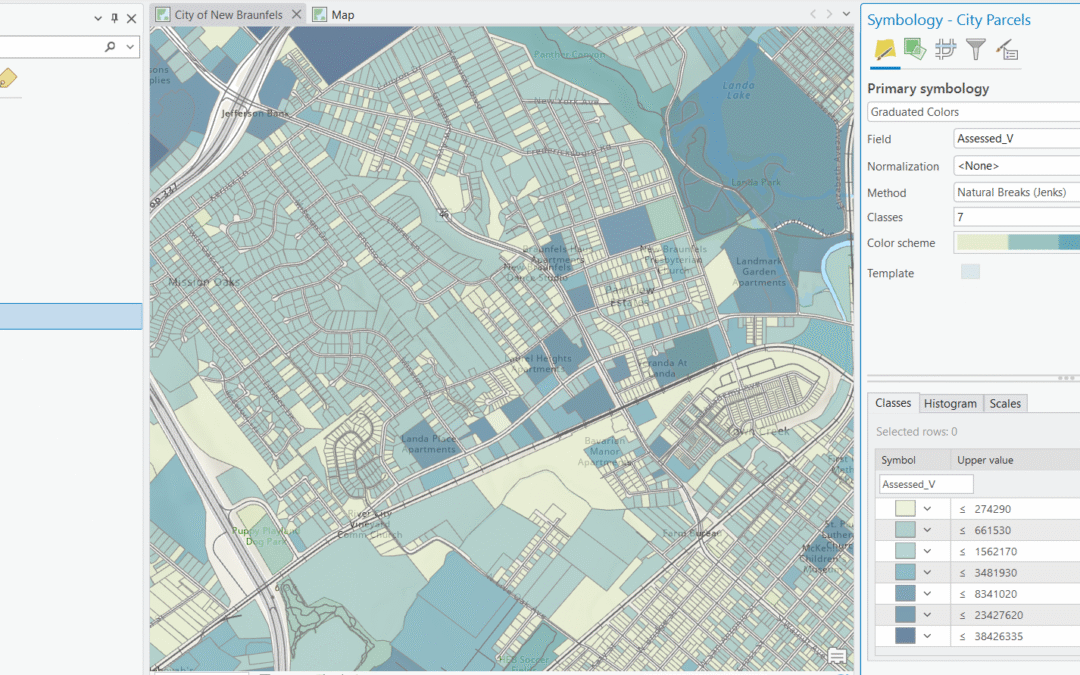
Mastering the Graduated Color Renderer in ArcGIS Pro: A Guide to Classification Methods
Learn more about this ArcGIS Pro topic and others in our Mastering ArcGIS Pro 3: Maps, Layers, Projects, and Layouts class and our Mastering ArcGIS Pro 3: Editing, Analysis, and Automation class. If you’ve spent any time making thematic maps in ArcGIS Pro,...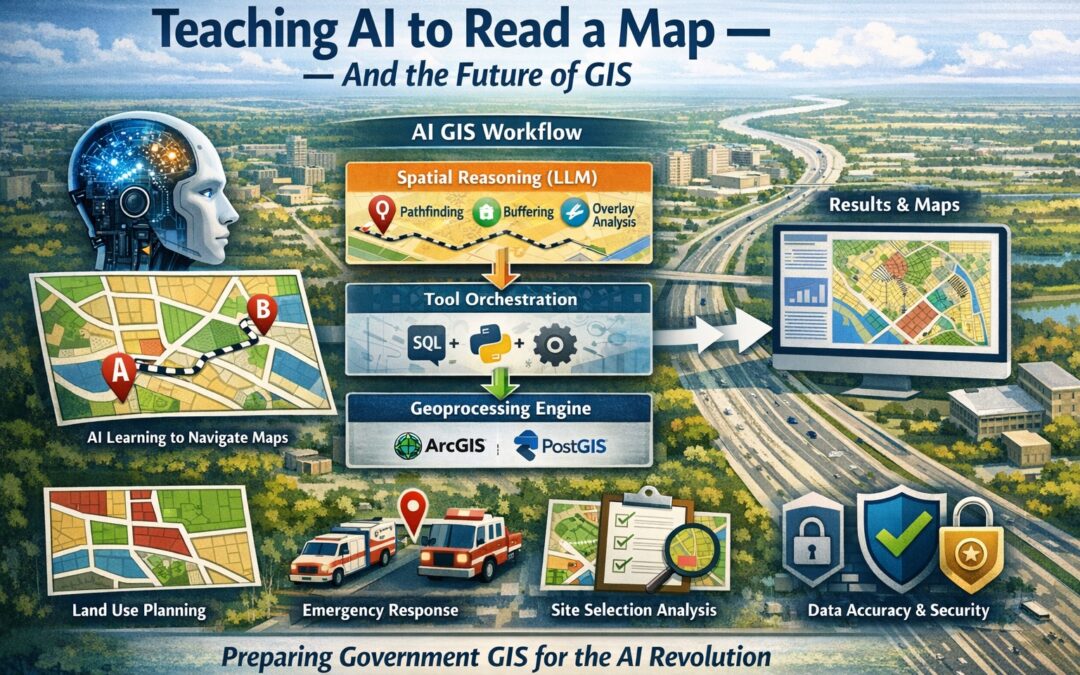
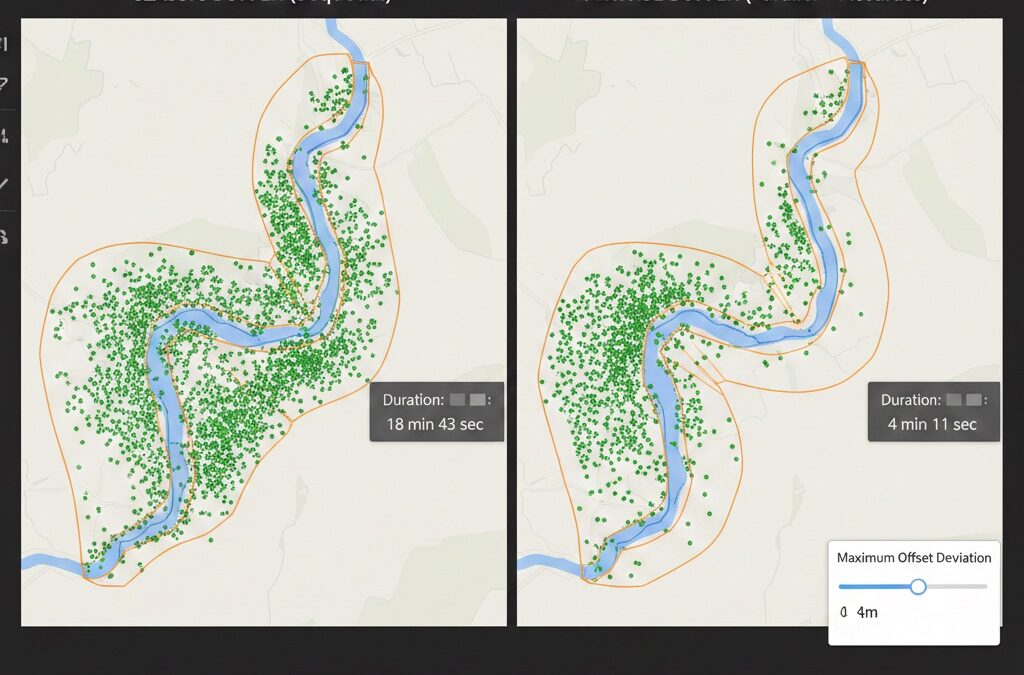
Spatial Intelligence Is Coming to LLMs — Is Government GIS Ready?
How Google’s MapTrace research reveals a broader revolution in spatial intelligence, and why local and state government GIS programs need to start preparing now. Look at a map of your city — the parcels, the streets, the zoning boundaries layered over...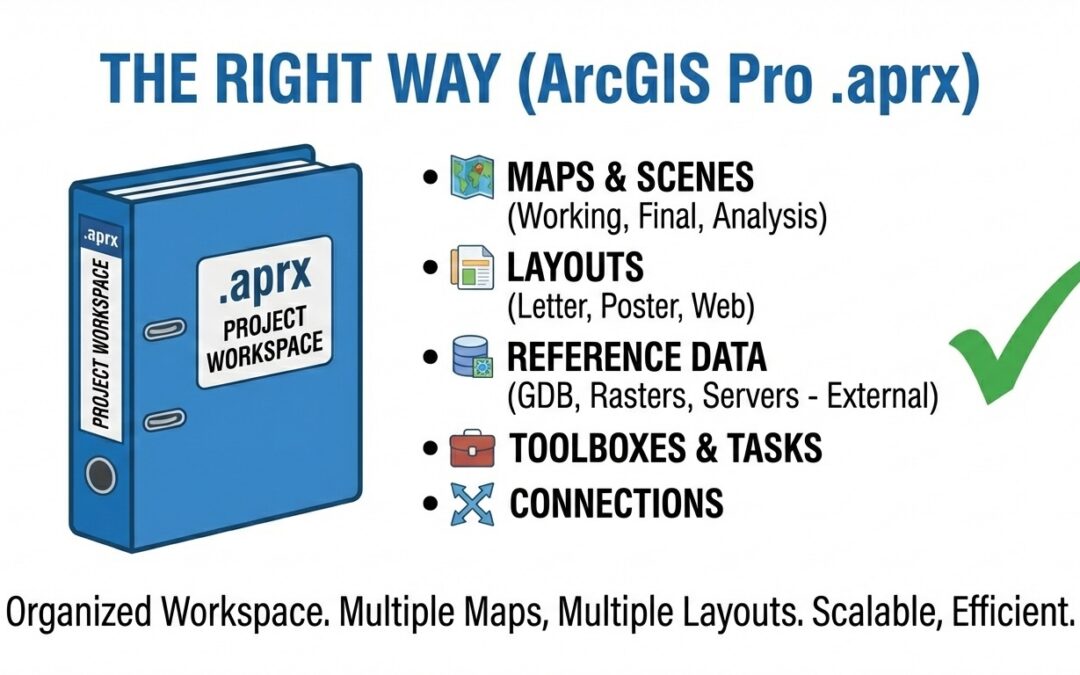
The Right Way to Manage ArcGIS Pro Projects, Maps, and Layouts (And Why Most People Get It Wrong)
If you want to go deeper on ArcGIS Pro project management, data organization, and building efficient workflows, check out our ArcGIS Pro training courses — including upcoming ArcGIS Pro Bootcamps in cities across the country and live-online. Most new to intermediate...
Using AI Assistants to Generate ArcGIS Pro Python Scripts for Automation
Geospatial Training Services offers hands-on courses in AI-assisted Python automation for ArcGIS Pro. Visit geospatialtraining.com to learn more about our upcoming bootcamps and live-online classes. For years, the barrier to automating GIS workflows has been the same:...