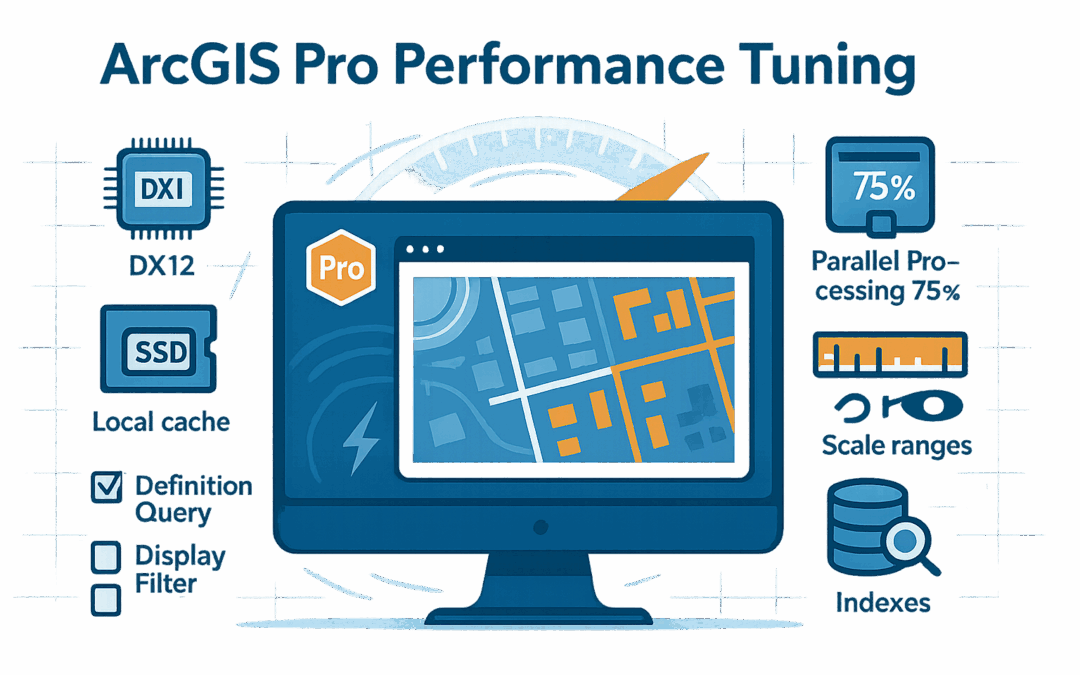

5 Time-Saving Data Management Tips in ArcGIS Pro That You’re Probably Not Using
While these five data management tips can significantly improve your workflow, mastering ArcGIS Pro requires comprehensive training across all its capabilities. Our ArcGIS Pro Class Bundle provides everything you need to become proficient in the software! Whether...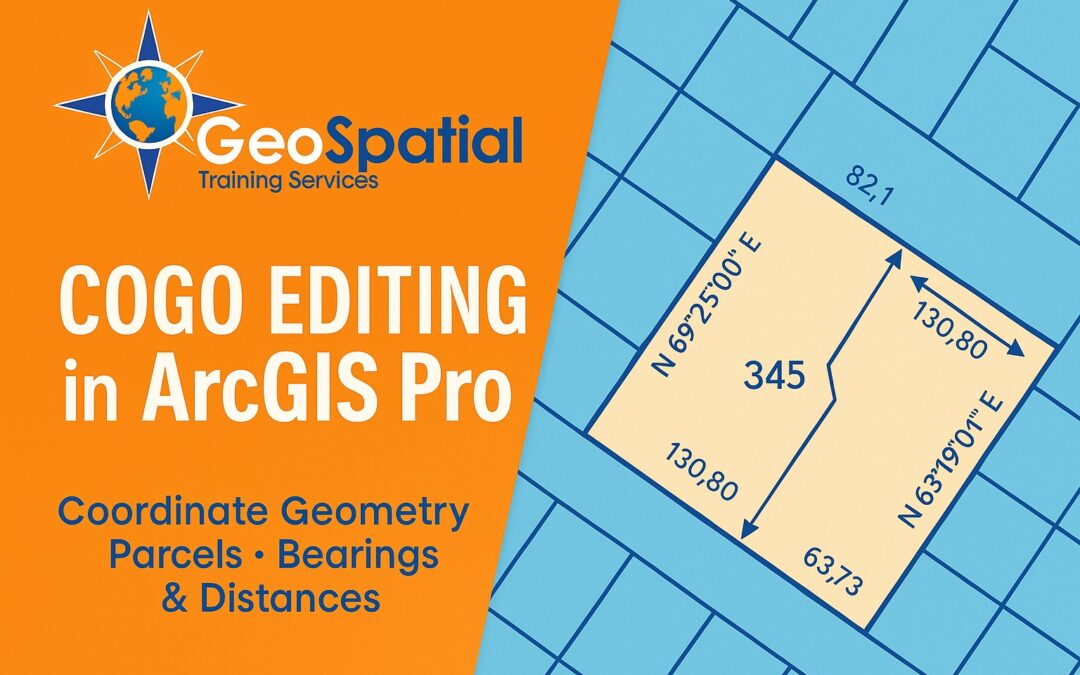
Understanding COGO: A Beginner’s Guide to Coordinate Geometry in ArcGIS Pro
Ready to master COGO editing in ArcGIS Pro? Professional training in coordinate geometry can enhance your GIS work with improved precision and professional credibility, opening new opportunities for career advancement and specialized project work. Our newly released...
Understanding the Geodatabase Format in ArcGIS Pro – Part 6
Read Part 1 Read Part 2 Read Part 3 Read Part 4 Read Part 5 Part 6: Geodatabase Development and Automation Welcome to the sixth installment of our ArcGIS Geodatabase series. In this article, we’ll explore the powerful world of geodatabase automation, focusing on...
File Geodatabases vs. Shapefiles: Understanding the Differences That Matter
For GIS professionals, choosing the right data format can significantly impact project efficiency, data integrity, and long-term sustainability. Two of the most commonly used vector data formats in the Esri ecosystem are shapefiles and file geodatabases. While both...
