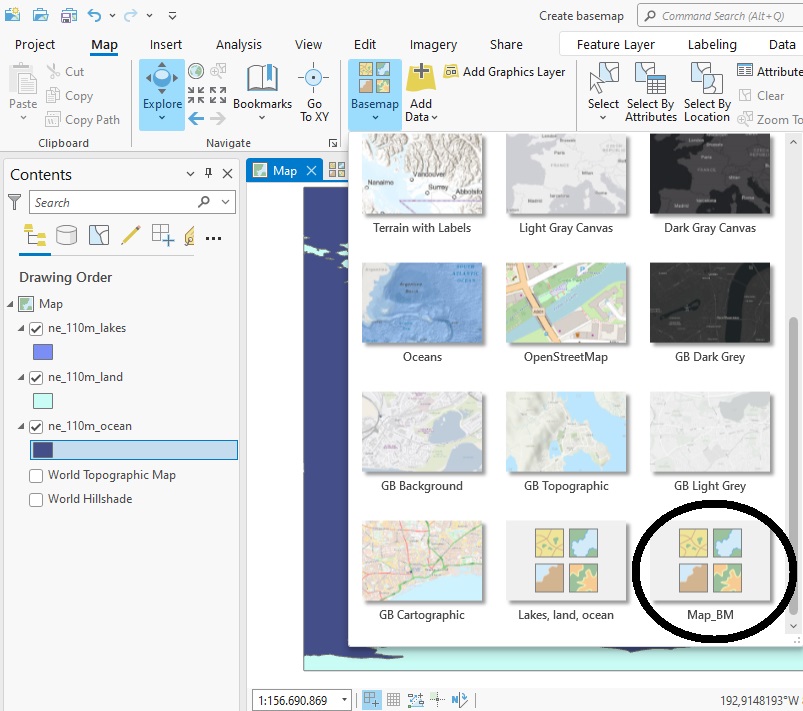
Tutorial: Creating Custom Basemaps with ArcGIS Pro
In this tutorial, you’ll learn how to create a custom basemap with ArcGIS Pro and add it to the default basemap gallery in Pro so you can use it for other projects. There are two ways to do this. First, we create an empty basemap and add data to it. Next, we’ll...
Annual Holiday Sale- November 21st – December 31st
Our annual holiday sale begins today! To celebrate our 17th year in business, Geospatial Training Services will be offering a 17% discount on many of our training products including: In-person trainingLive-online trainingSelf-paced trainingSelf-paced...
Tutorial: Catalog and Find Geospatial Data with Python
In this tutorial, you’ll learn how to catalog data using Python. Specifically, we’ll use the arcpy and os modules to move through a directory tree to catalog and find data. The os module is used to interact with your operating system, move through a directory and find...