Exporting Census Data to Shapefiles with R
In a previous article you were introduced to using US Census data using the tidycensus R package. In that article you learned how easy it is to generate R datasets containing either decennial or American Community Survey (ACS) data and visualize that information as...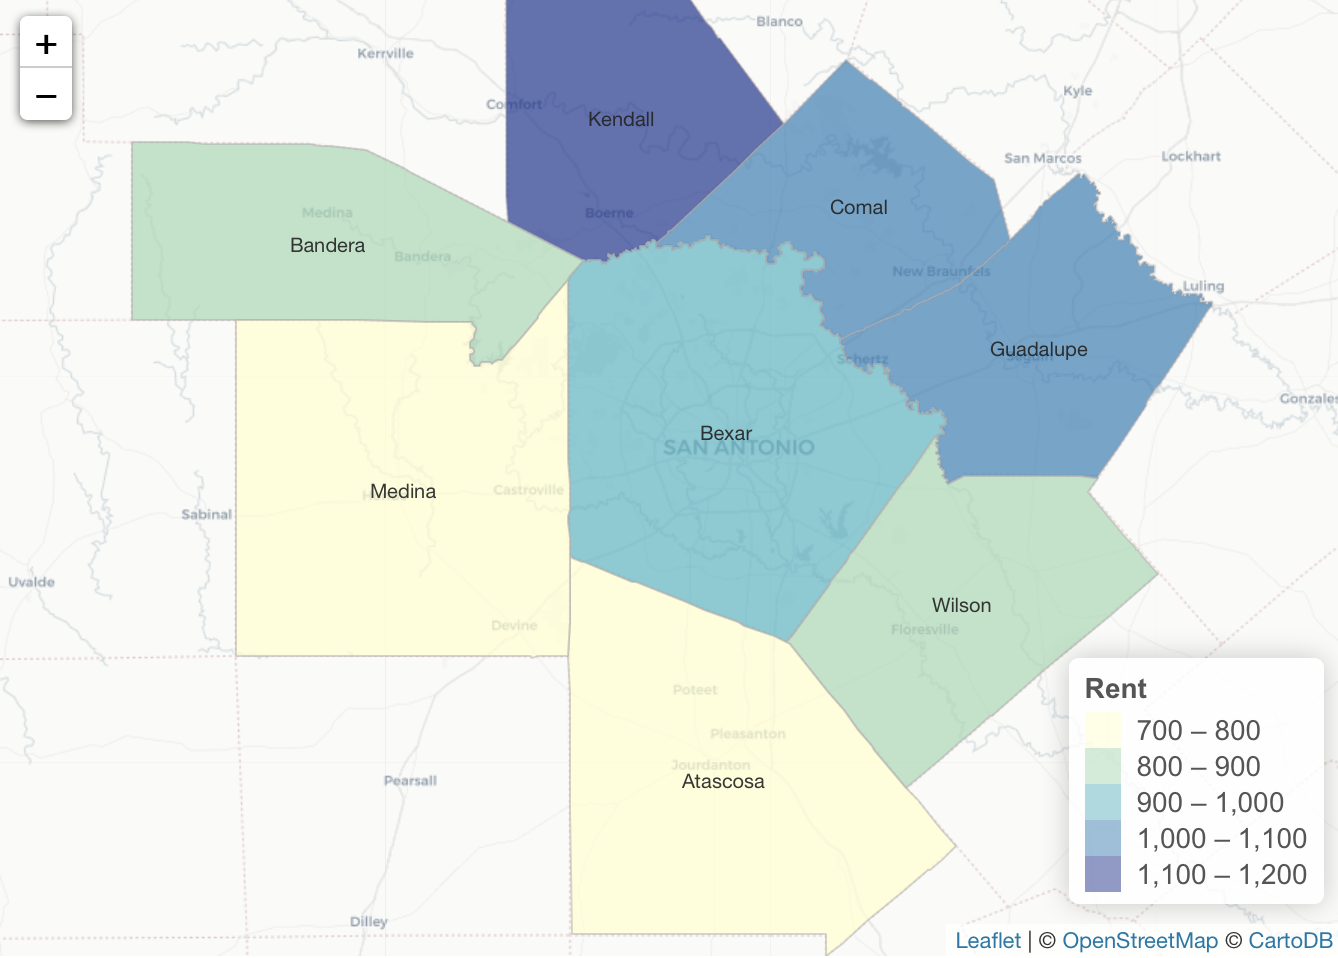
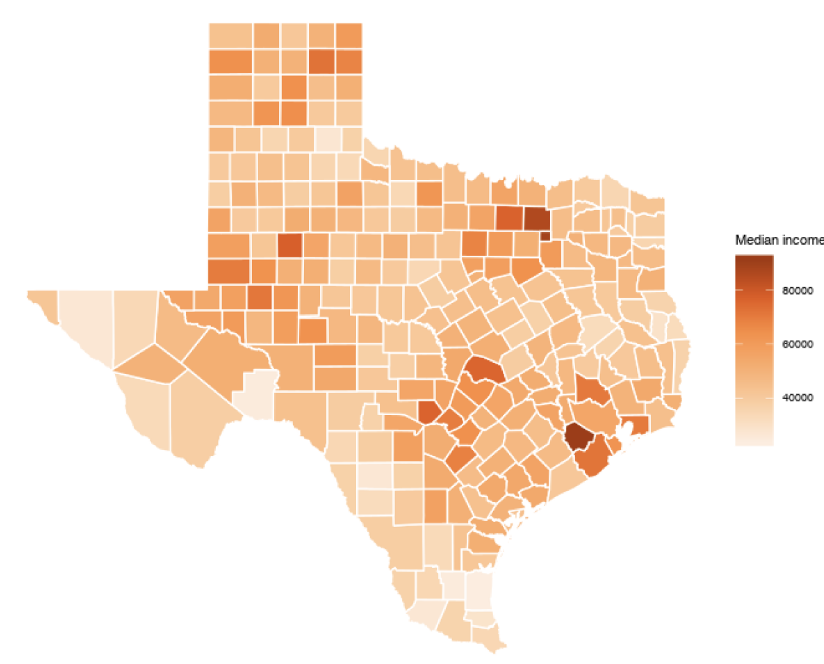
Exploring and Mapping Census Data with R
This will be the first of multiple posts that explores how you can use R to efficiently load and visualize U.S. Census data using a variety of packages including tidycensus and tidyverse. The US Census Bureau has made its datasets available to the public through a...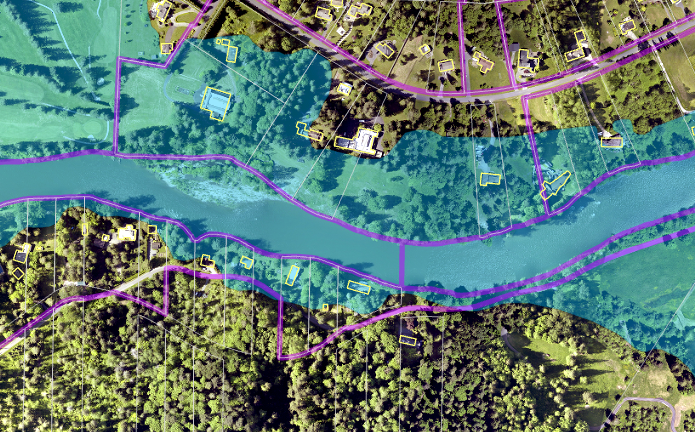
Using R and RStudio as a Fast and Flexible Data Exploration Tool
This is a guest post by Fred Lott and was originally published on the GIS & You blog hosted by King County GIS. There is a wide array of powerful free open-source tools for doing data analysis, and many of them can now handle spatial data. This post will focus on...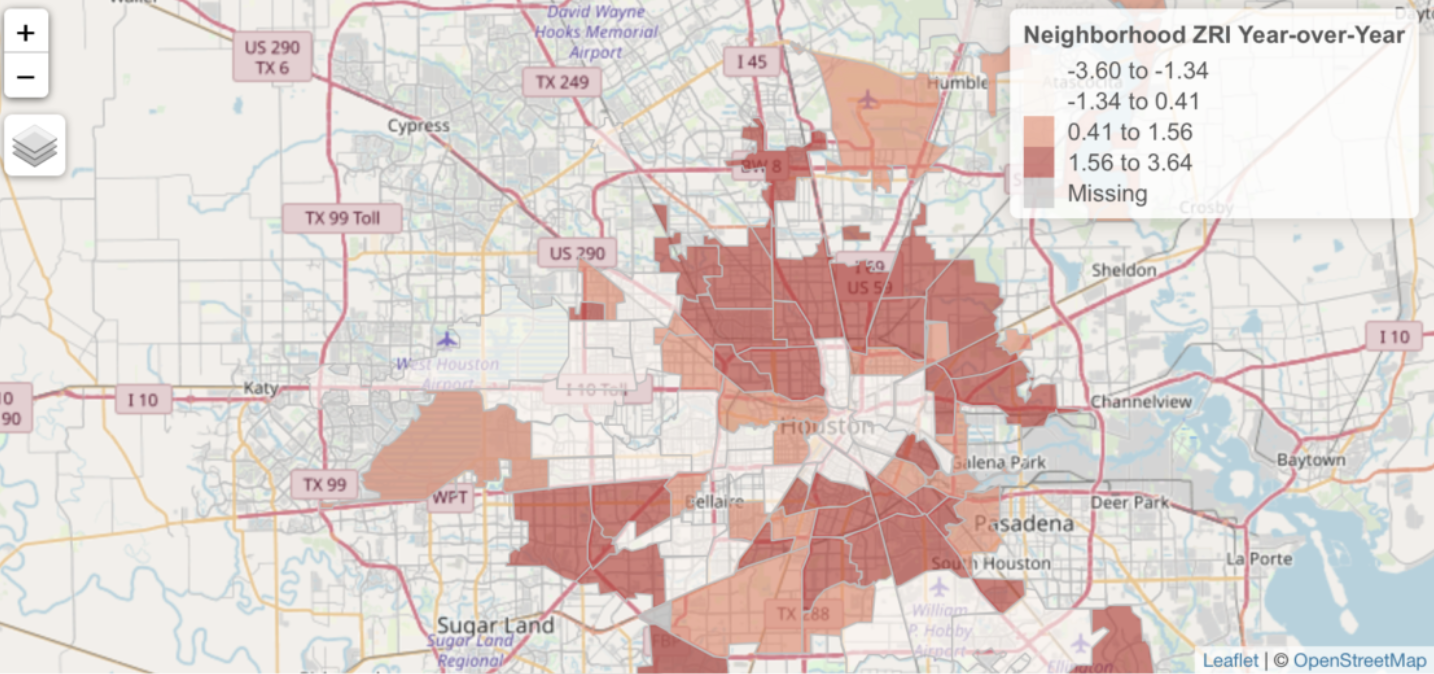
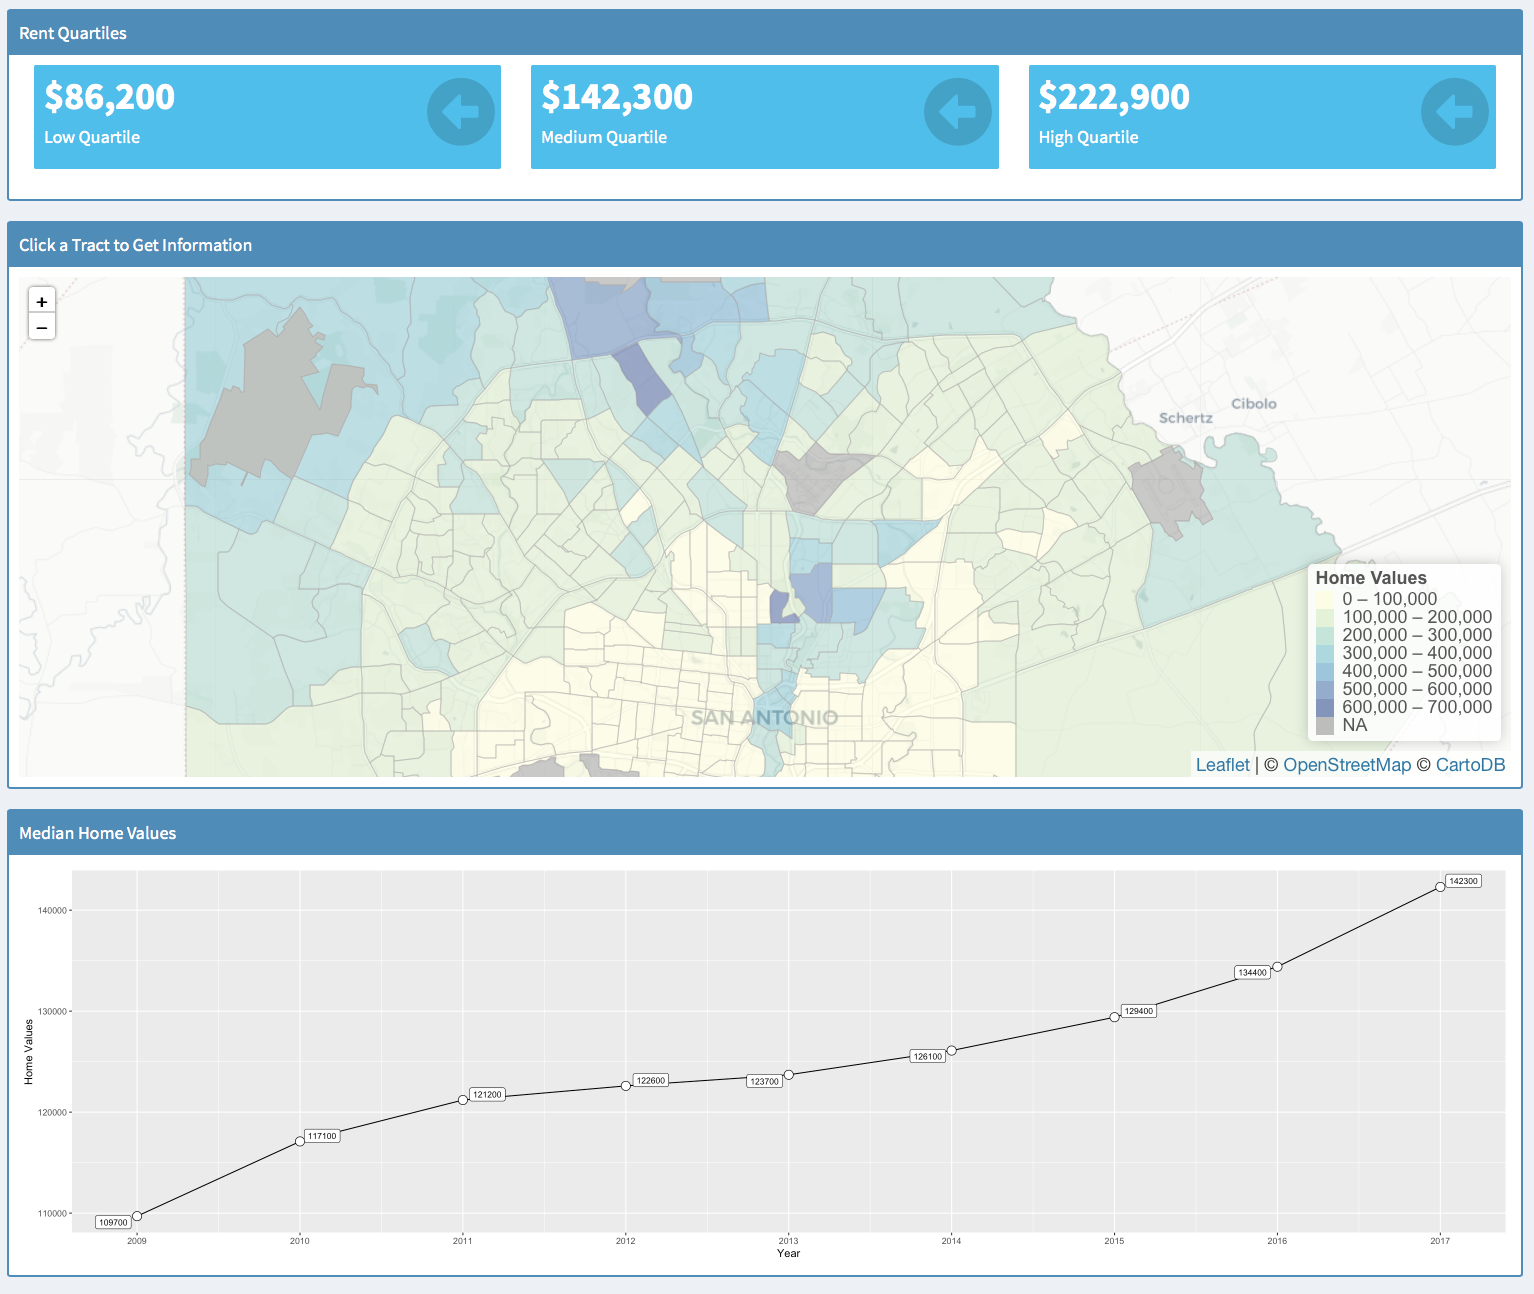
Zillow Local Market Rental Overview Application
Head over to our sister site – Location3x – and check out a sample application that we built with Shiny and R. The Zillow Market Overview: Rentals application is a dynamic web application that illustrates the visualization capabilities provided by the...