

The 2017 wildfire season shattered records and cost the U.S. Forest Service an unprecedented $2 billion. From the Oregon wildfires to late season fires in Montana, and the highly unusual timing of the California fires in December, it was a busy year in the Western United States. While 2017 was a particularly notable wildfire season, this trend is nothing new and research suggests we can expect this unfortunate trend to continue due to climate change and other factors. A recent study suggests that over the next two decades, as many as 11 states are predicted to see the average annual area burned increase by 500 percent.
Using the Federal Wildland Fire Occurrence Database, Geospatial Training Services and Location3x recently used the R programming language to better visualize the change in wildfire activity from 1980 to 2016. Our analysis was limited to the Western United States including California, Arizona, New Mexico, Colorado, Utah, Nevada, Utah, Oregon, Washington, Idaho, Montana, and Wyoming. We were particularly interested in the surge of large wildland fires, categorized as fires that burn greater than 1,000 acres.
Here, in visual form are the visualizations of this dataset for Montana. All charts were produced in RStudio using the ggplot2, readr, dplyr, lubridate, and ggmap packages.
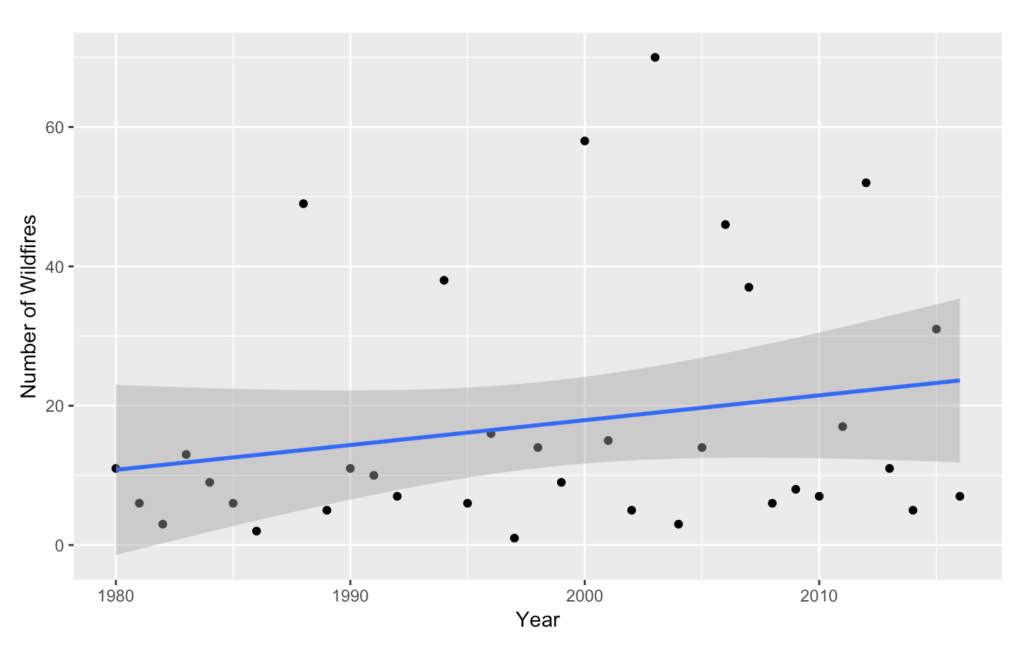
Number of Wildfires
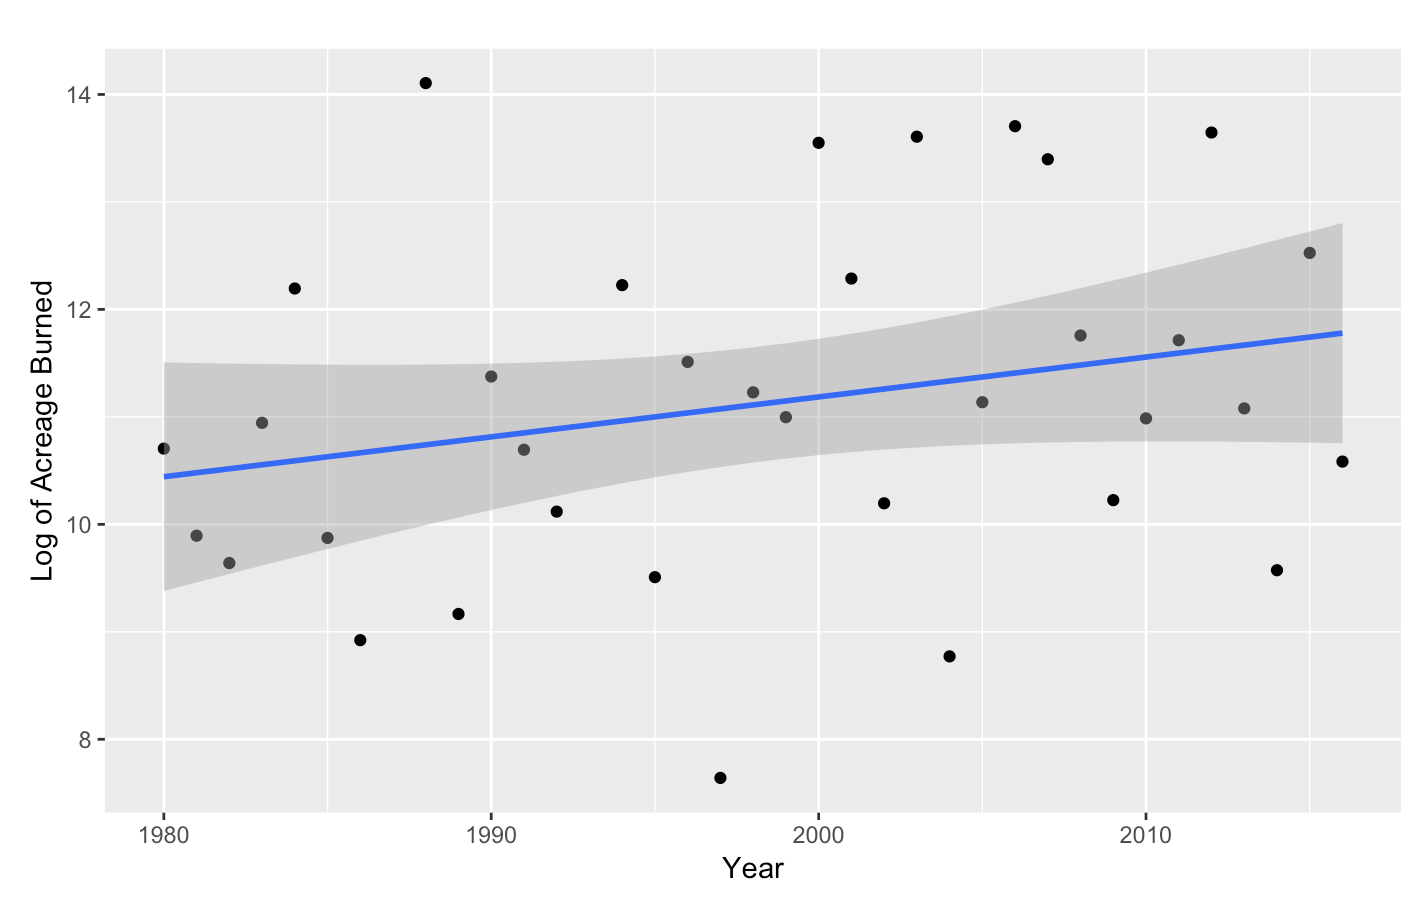
Log of Acreage Burned
Length of Fire Season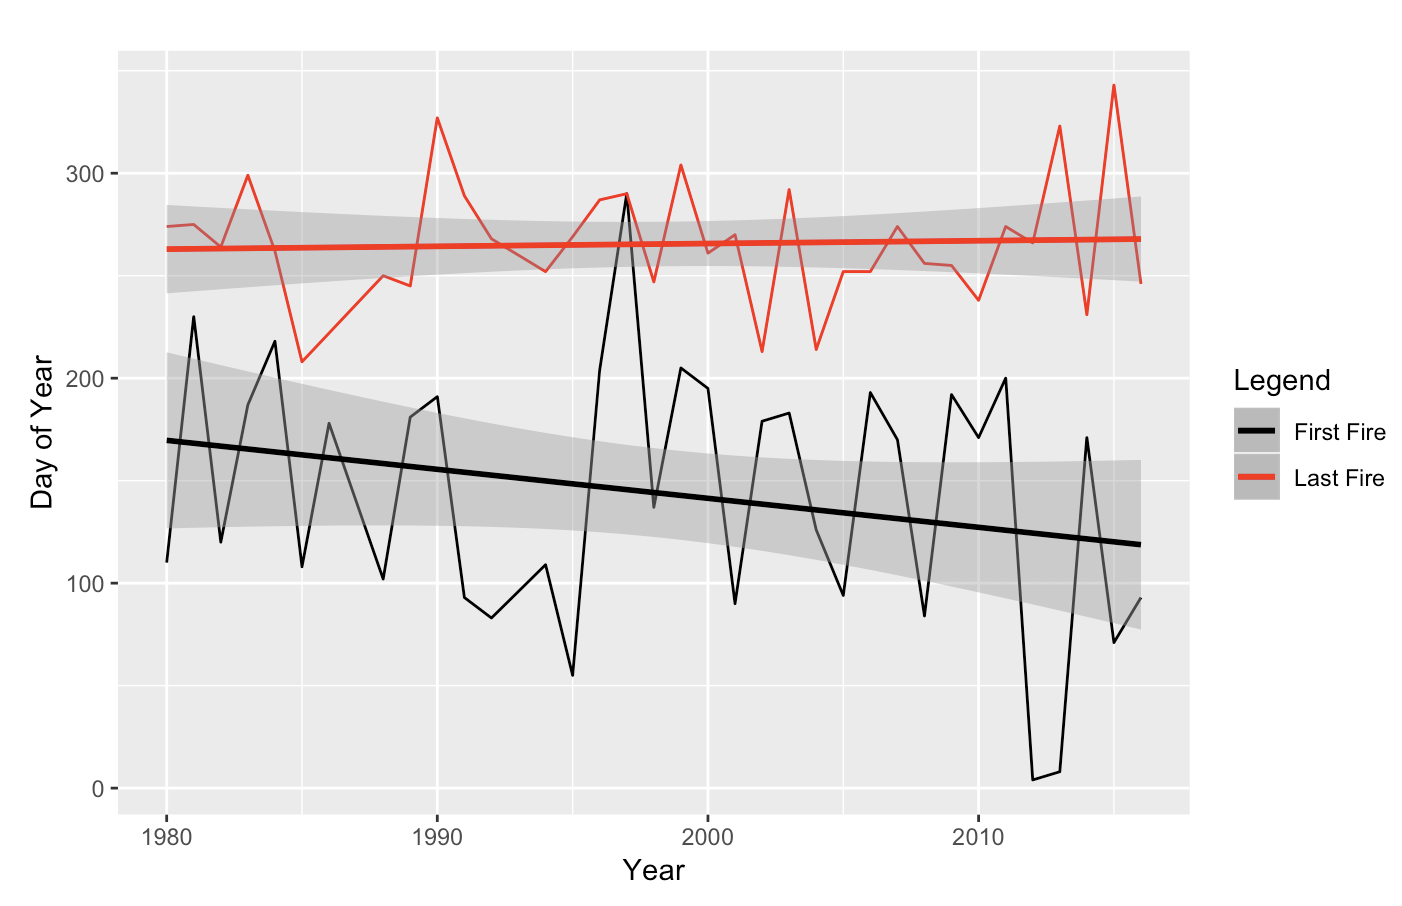
Large Wildfire Occurrence (All Causes)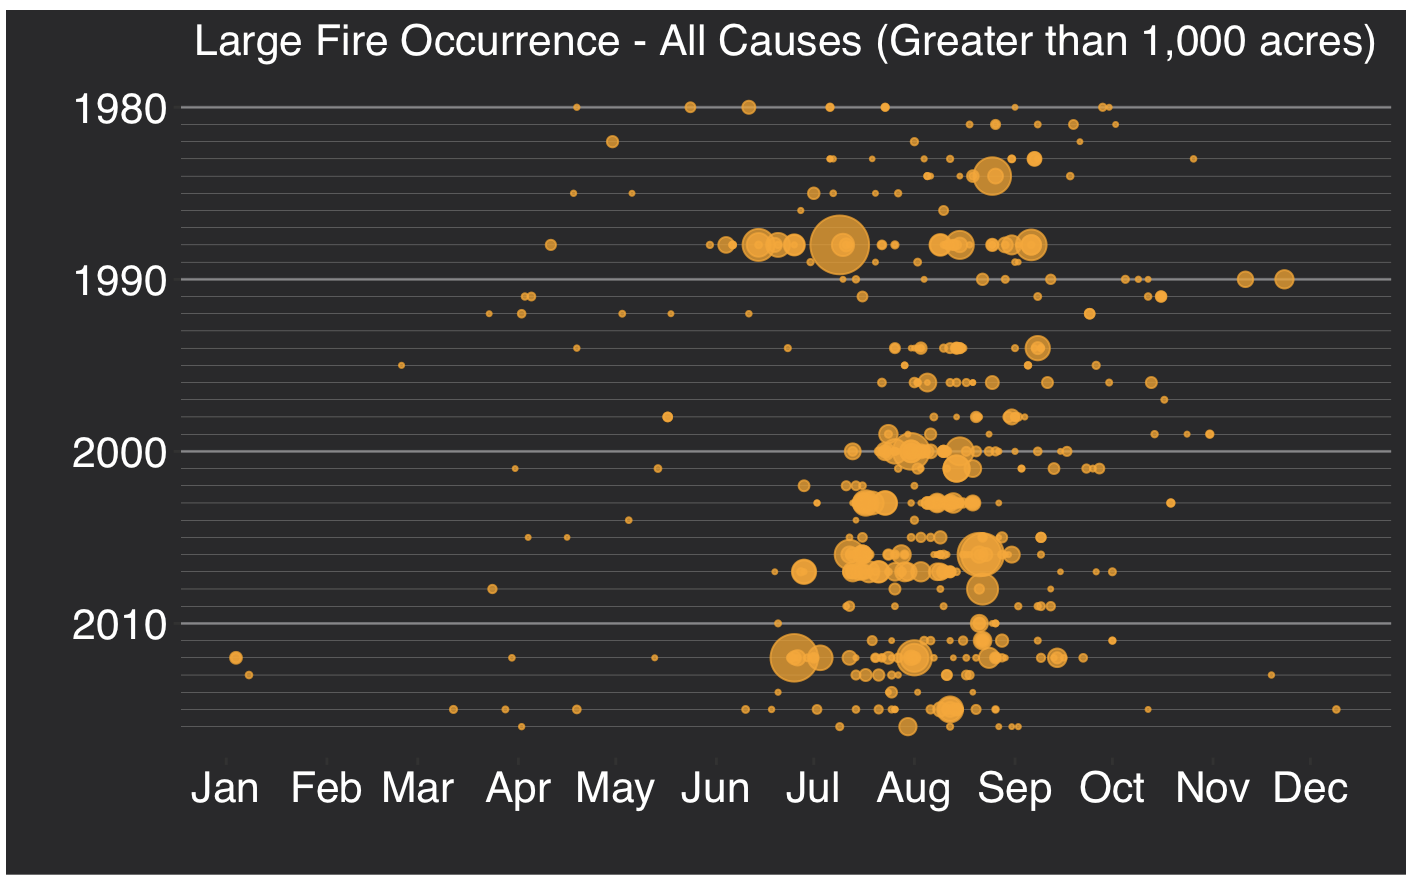
Naturally Occurring Wildfires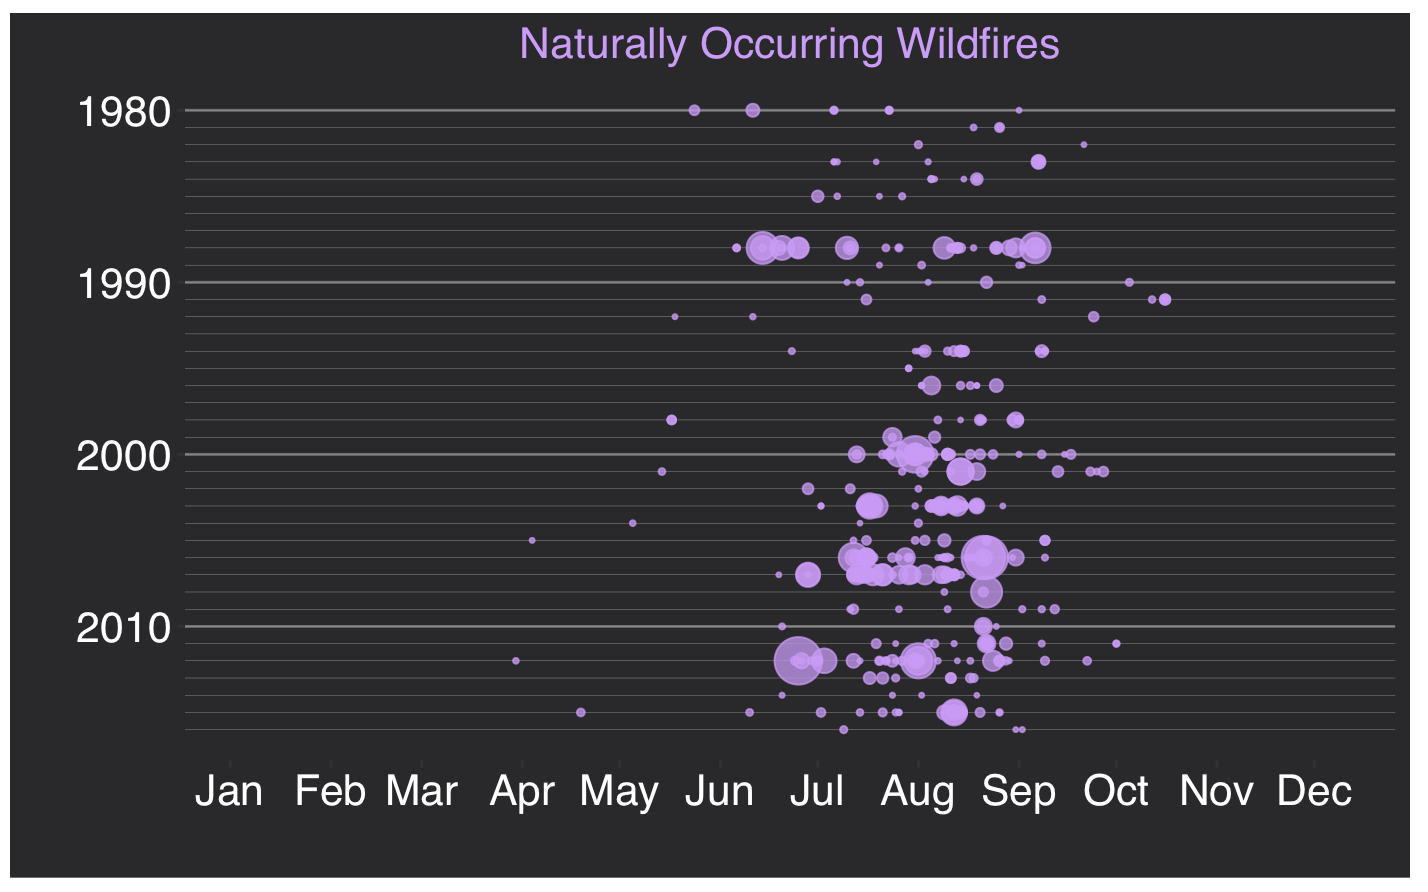
Human Caused Wildfires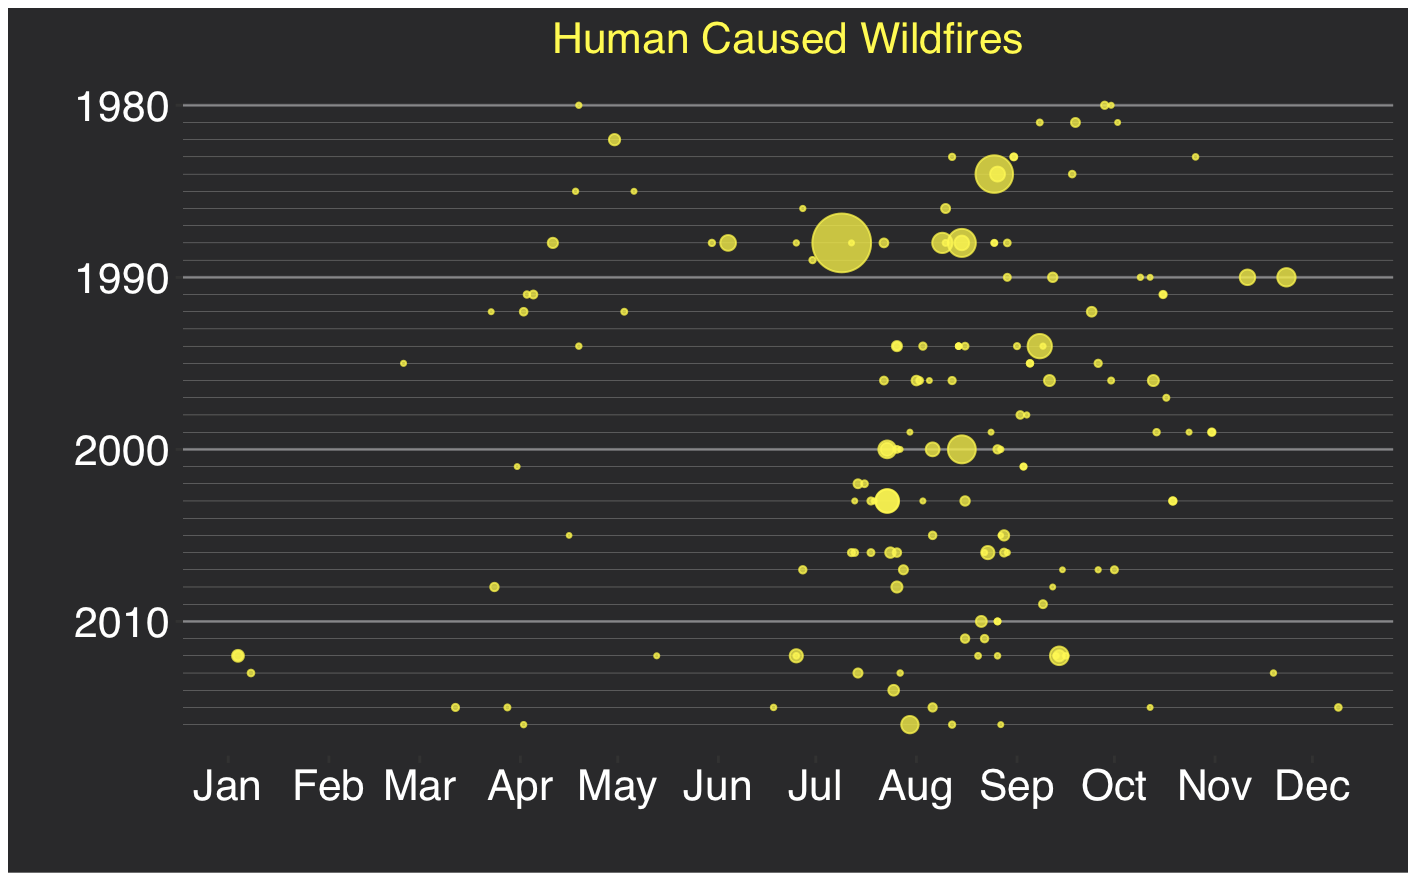
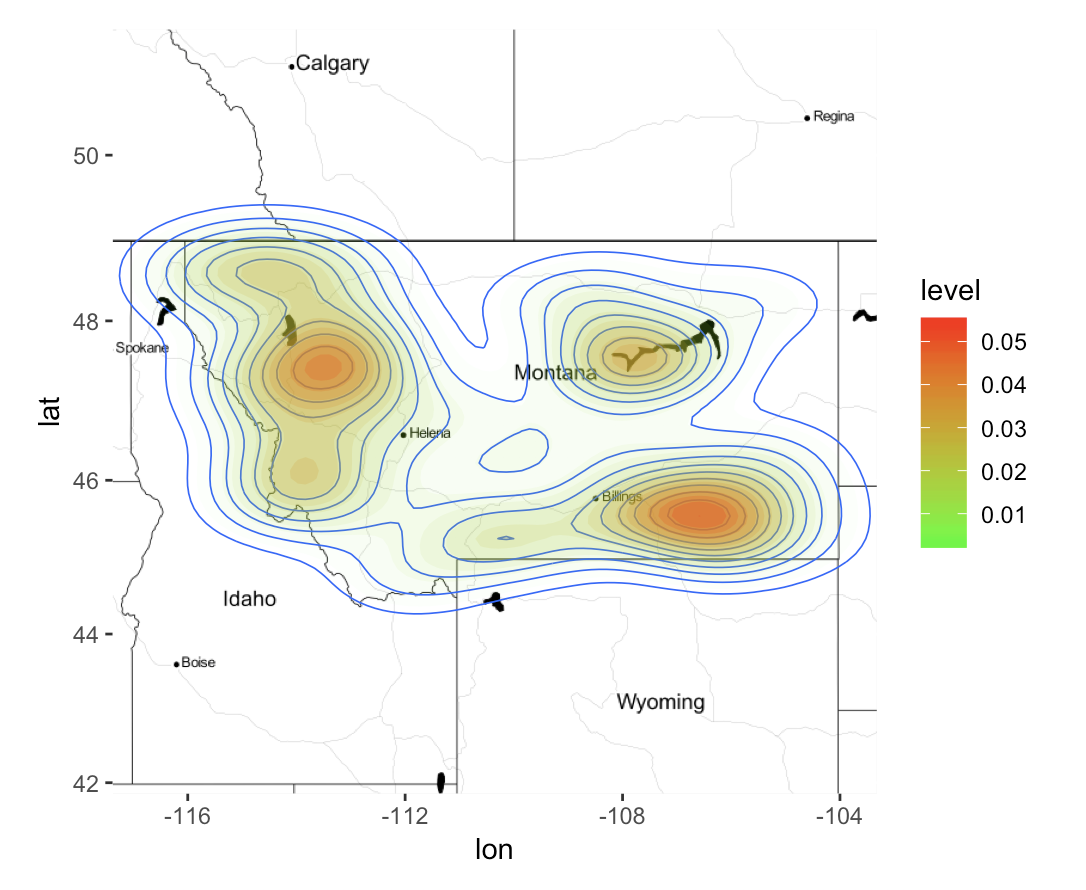
Large Wildfire Density Map
Want to learn more about how you can create data visualizations with R? Take a look at our Data Visualization and Exploration class.
