
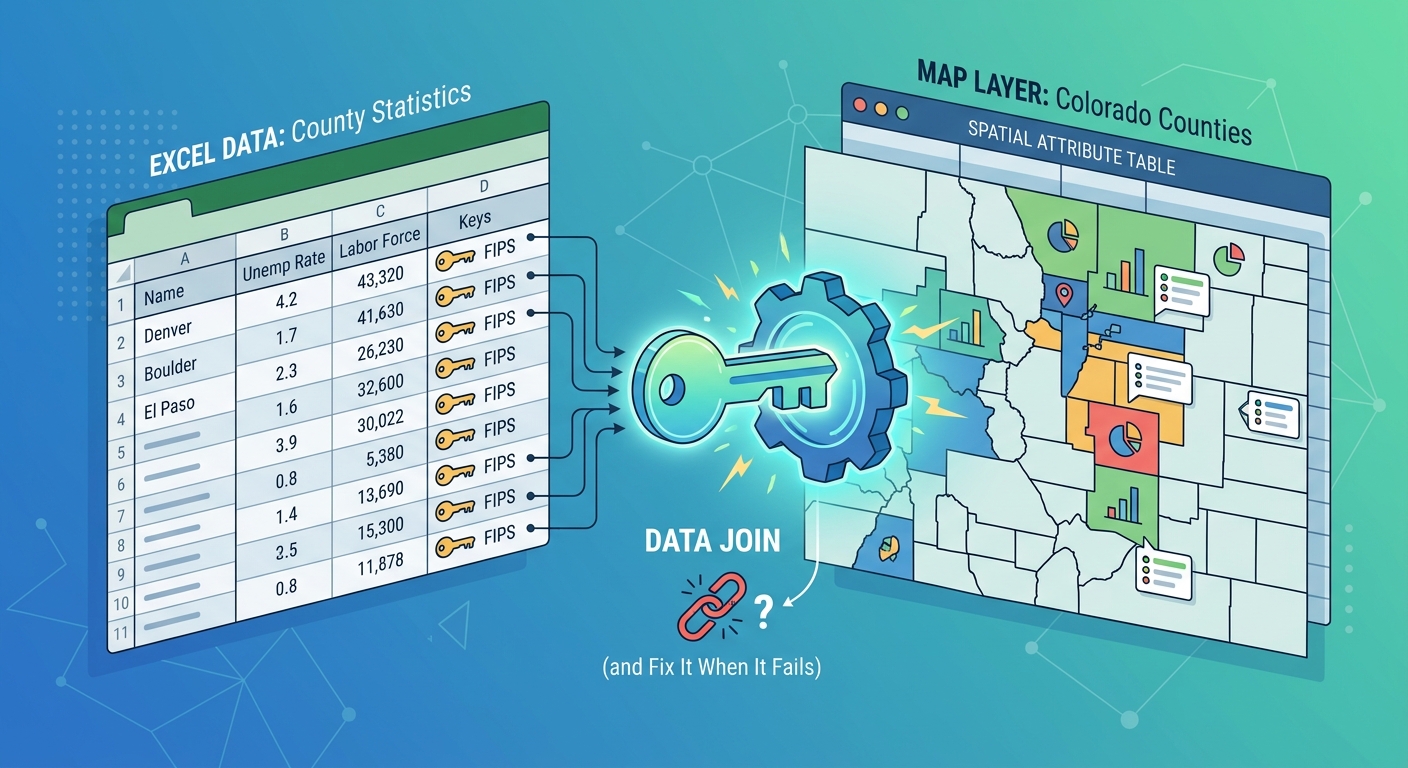
You have a spreadsheet full of data and a map layer, and you want them together. Joins in ArcGIS Pro are one of the most common tasks there is. They are also one of the most common sources of frustration. The join runs without an error, you open the attribute table, and the new fields are empty.
This post walks through a basic join and then covers the problems that cause most failed joins and how to fix each one.
To follow along, download the sample workbook. It has data for all 64 Colorado counties. The county names and FIPS codes are real, but the unemployment and labor force numbers are made up for practice. The workbook has three sheets:
- Clean_Data is set up correctly and should join without trouble.
- Messy_Data has been set up to fail in several ways.
- Multi_Year has three years of data per county for the one-to-many section.
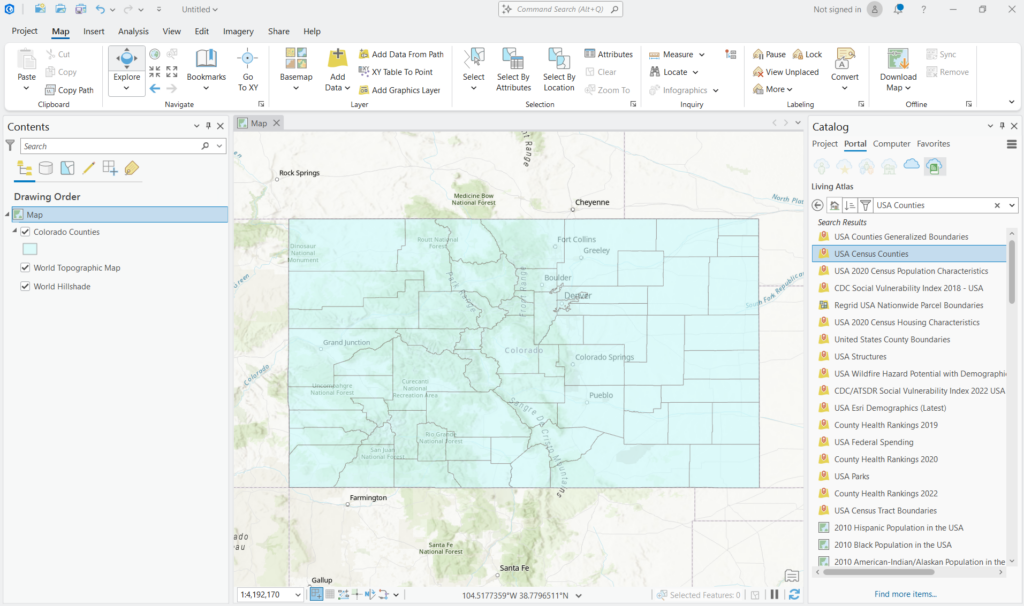
You’ll also need a U.S. counties layer, such as USA Counties from the Living Atlas. Before you start, add a definition query to the layer so it only shows Colorado, where the state FIPS code is 08. Otherwise, every county outside Colorado shows up as unmatched, and it’s hard to tell whether your join worked. Note: In this screenshot below I’ve added the definition query and I’ve also renamed the layer to Colorado Counties.
Part 1: A join that works
Add your counties layer to a map. Then add the spreadsheet by adding a folder connection where the .xlsx file has been downloaded. Note: You may need to create a new folder on your computer and copy the downloaded .xlsx file to the folder as seen in the screenshot below. Here I created a folder called ArcGISPro_Join, copied the .xlsx file to the new folder, and added a folder connection in Pro.
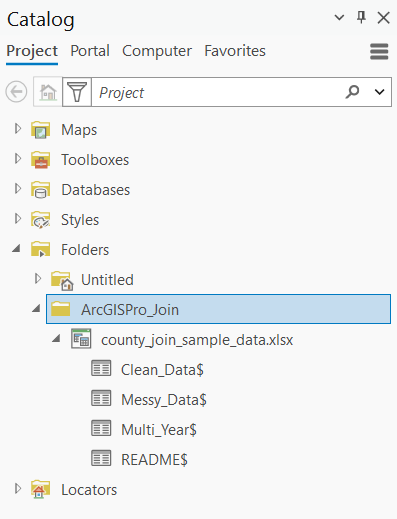
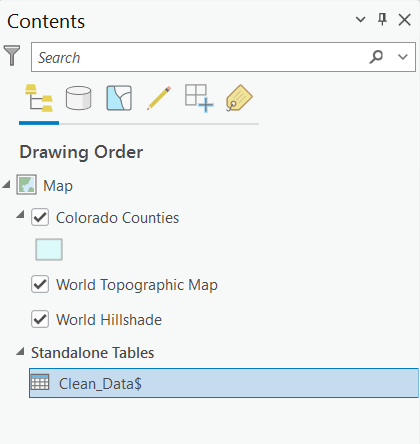
Each sheet shows up as its own table with a dollar sign at the end, like Clean_Data$. Drag that table into the map.
To create the join:
- In the Contents pane, right-click the counties layer and choose Joins and Relates > Add Join.
- The Input Table is your counties layer.
- Set the Input Field to the FIPS field in the counties layer.
- Set the Join Table to
Clean_Data$. - Set the Join Table Field to
FIPS. - Leave Keep all input records checked. With this checked, counties without a match stay on the map with empty values. If you uncheck it, those counties are removed from the layer.
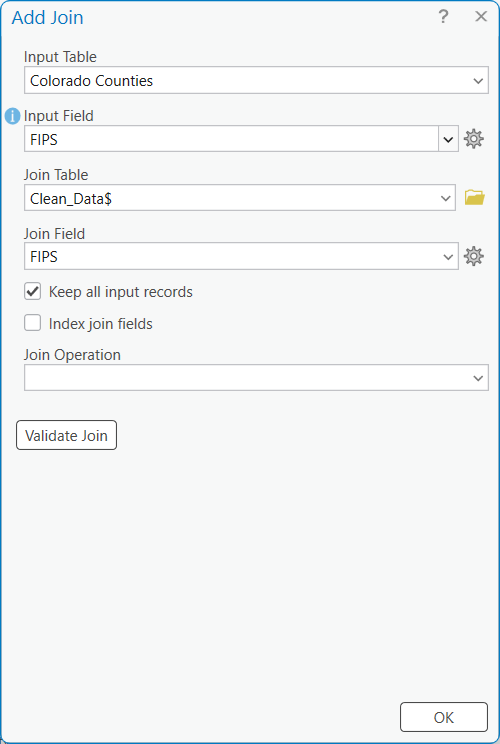
Don’t click OK yet. There is one more step that saves a lot of trouble.
Part 2: Validate the join before you run it
At the bottom of the Add Join pane is a Validate Join button. Click it. ArcGIS Pro checks the two fields and tells you how many records matched. It also warns you about problems like mismatched field types or a large table without an index on the join field.
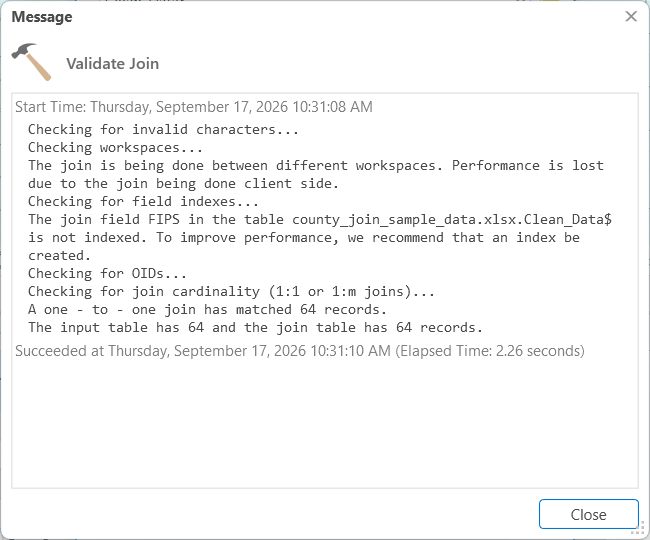
With the Clean_Data sheet, all 64 counties should match. If the number of matches is lower than you expect, stop and fix the data first. It’s much easier than figuring out later why your map looks wrong. You will see some warnings about the lack of an index and the data being in different workspaces but neither of those warnings will impact the matching.
Click OK to run the join.
Part 3: See the results of the join
Now that the join has run, take a look at the results.
Open the attribute table
- In the Contents pane, right-click the counties layer and choose Attribute Table.
- Scroll to the right. The original fields from the counties layer come first, followed by the fields from the spreadsheet.
- Compare the FIPS field from the counties layer with the
FIPSfield from the spreadsheet. On every row, the two values should be identical, since that’s what the join matched on.
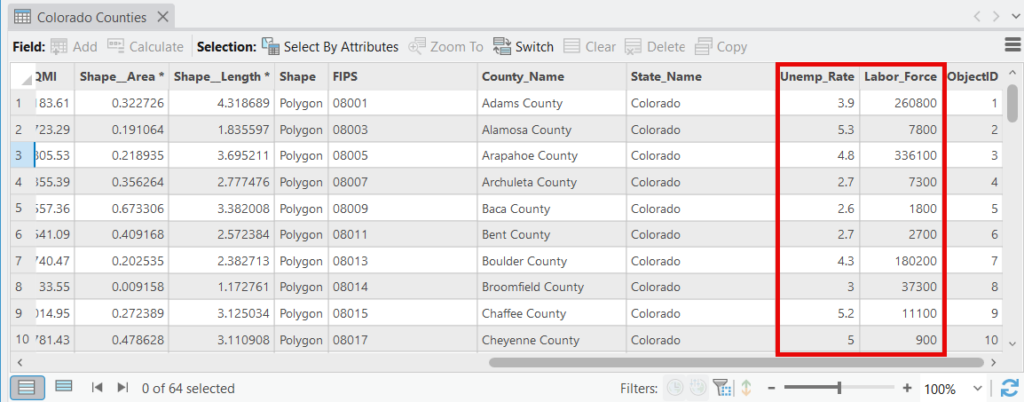
Tip: A quick map is another good check. Right-click the layer, choose Symbology, and set it to Graduated Colors using the Unemp_Rate field. If every county gets a color, every county has a value. Any county that stays empty or gray didn’t match.
If the join had missed any counties, their joined fields would show as <Null>. Sort a joined field like Unemp_Rate in the attribute table, and nulls move to the top or bottom. With Clean_Data you shouldn’t find any. If you ever do, the next section covers the usual causes.
Part 4: Fix a spreadsheet that won’t join
The Clean_Data sheet joined without trouble. Real spreadsheets are rarely that tidy. The Messy_Data sheet has the kinds of problems you’ll run into in real work. In this part, you’ll find each problem, fix it, and then join the fixed table to the counties layer.
Step 1: Remove the existing join
A layer can have more than one join, and leaving the Clean_Data join in place will make the results confusing.
- In the Contents pane, right-click the counties layer.
- Choose Joins and Relates > Remove All Joins.
- Open the attribute table and scroll right to confirm the joined fields are gone.
Step 2: Look at the Messy_Data sheet
In the Catalog pane, expand the Excel file and drag Messy_Data$ into the map. Right-click it in the Contents pane and choose Open.
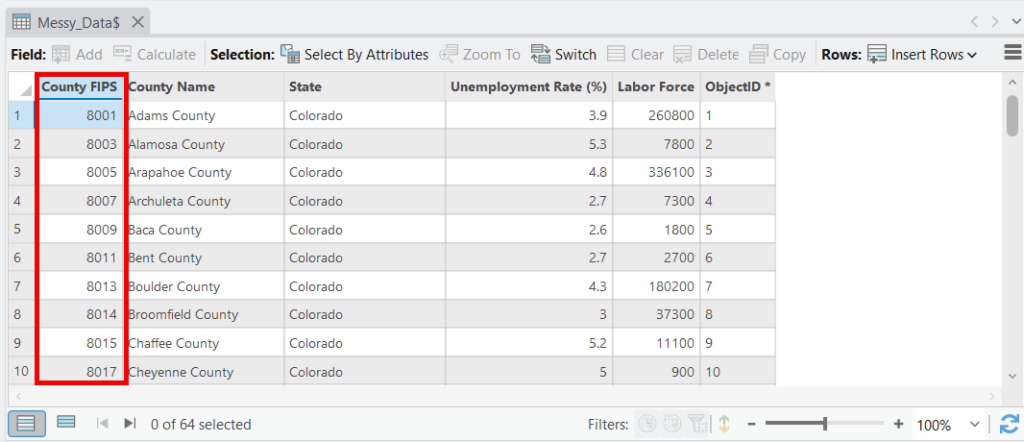
At first glance, the table looks fine. It has the same columns as Clean_Data, with one row for each county. Look more closely, though, and you’ll start to see problems. The FIPS codes are 8001, 8003, and so on, when they should be 08001 and 08003. There are other problems you can’t see as easily, which you’ll find in the steps below.
You can’t fix any of this inside ArcGIS Pro while the data is still in the Excel file, because ArcGIS Pro reads Excel files as read-only. You can’t edit cells or add fields. So the next step is to copy the sheet into your geodatabase, where you can edit it.
Note: If ArcGIS Pro won’t open the Excel file at all, you may be missing the Microsoft driver it needs to read Excel files. Search Esri’s documentation for “Work with Microsoft Excel files in ArcGIS Pro” to find the right driver for your version. Saving the sheet as a CSV also works around the problem.
Step 3: Copy the sheet into your geodatabase
- On the Analysis tab, click Tools and search for Excel To Table.
- Set Input Excel File to the sample workbook.
- Set Output Table to your project geodatabase and name it
Messy_Data_Table. - Set Sheet to
Messy_Data. - Leave the other settings at their defaults and click Run.
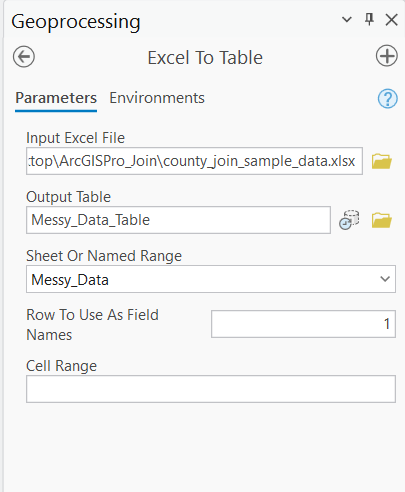
The new table is added to the map. Open it and check the record count at the bottom of the table. It should show 64 records, one for each county.
The column headings from the spreadsheet appear at the top of the table, including the spaces and symbols, like County FIPS and Unemployment Rate (%). What you’re seeing are field aliases, not the actual field names. Field names in a geodatabase can’t have spaces or most symbols, so the tool replaced them with underscores in the field names and kept the original headings as aliases. To see both, right-click the table in the Contents pane and choose Data Design > Fields. The Field Name column shows names like County_FIPS, and the Alias column shows the original headings.
The difference matters when you write expressions. Arcade and Python expressions use the field name, not the alias. That’s why the expressions later in this post use County_FIPS instead of County FIPS.
Now look at the data itself. There are three problems to fix.
Step 4: Fix the FIPS codes
Look at the County FIPS column. The codes are 8001, 8003, and so on. They should be 08001 and 08003.
FIPS codes are five characters long, and Colorado’s state code is 08, so every county code starts with a zero. Excel treated the codes as numbers and dropped the zero. This causes two problems at once:
- The values don’t match.
8001isn’t the same as08001. - The field types don’t match. The codes came in as a number field, but the FIPS or GEOID field in the counties layer is text. A number field won’t join to a text field, even when the values look the same.
This is the most common reason joins fail. With a spreadsheet covering many states, you’d see a different pattern: counties in states 01 through 09 would fail to match, while counties in states like Texas would join fine. The cause is the same.
To fix it, create a new text field with the leading zeros added back:
- Right-click
Messy_Data_Tablein the Contents pane and choose Data Design > Fields. - Add a new field named
FIPS_Text. Set the type to Text and the length to 5. - On the Fields tab, click Save.
- Open the table, right-click the
FIPS_Textheading, and choose Calculate Field. - Use one of these expressions and click OK.
Arcade:
Text($feature.County_FIPS, '00000')Python:
str(int(!County_FIPS!)).zfill(5)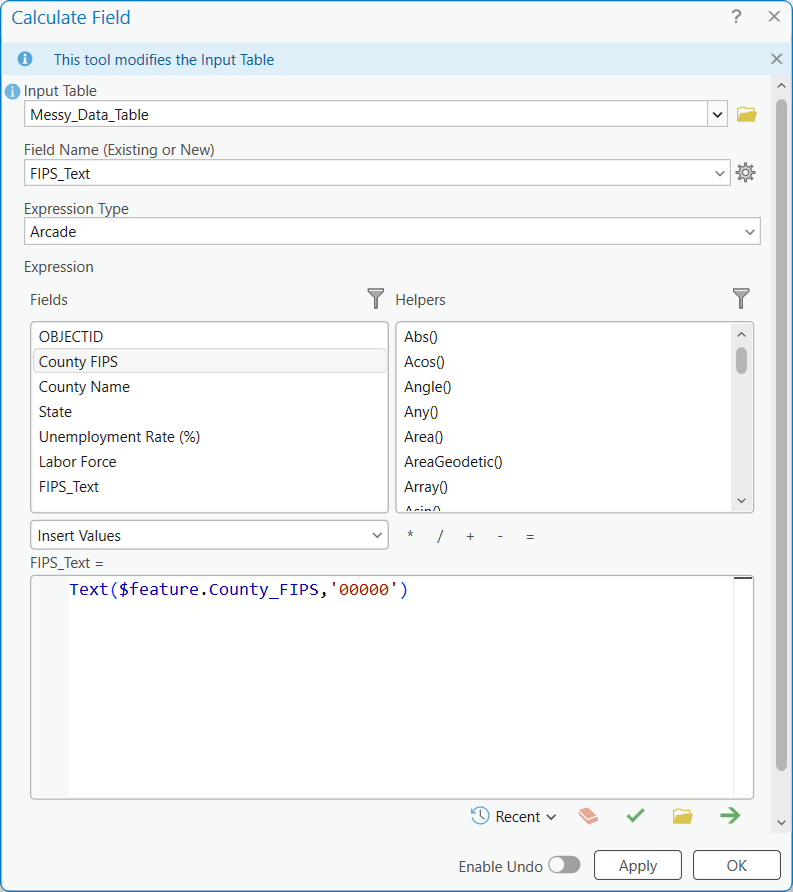
Check the table. FIPS_Text should now show 08001, 08003, and so on for every county. This is the field you’ll use for the join.
Prevent it next time: In Excel, format a code column as Text before you type or paste data into it. Formatting it after the zeros are gone won’t bring them back.
Step 5: Clean up the county names
You’re joining on FIPS codes, so the name problems won’t stop this join. They’re still worth fixing, because they cause trouble any time you join or search on names.
Extra spaces. Arapahoe, Denver, El Paso, Larimer, and Pueblo counties have a space at the end of the name. Denver County isn’t the same as Denver County, and you can’t see the difference in the table. To remove spaces at the start and end of every name, right-click the County Name column heading, choose Calculate Field, and use one of these expressions:
Arcade:
Trim($feature.County_Name)Python:
!County_Name!.strip()A spelling difference. The sheet lists La Plata County as LaPlata County. To fix it, double-click that cell in the attribute table, type La Plata County, and press Enter. Then click Save on the Edit tab.
This is a good example of why codes are better than names for joins. Codes don’t have spelling variations. Names can also repeat. Colorado has a Washington County, and so do many other states. If you have to join on names, clean up the variations first and include the state in the match.
Step 6: Check for text in number fields
Hinsdale County has N/A in the labor force column instead of a number. One text value in a column of numbers can cause trouble when the data comes into ArcGIS Pro.
Open the Fields view for the table and look at the type of the labor force field.
- If it’s a number field, Hinsdale’s value came in as null, which is what you want. Nothing else to do.
- If it’s a text field, the whole column came in as text, and you can’t use it in math or a graduated colors map. Add a new field named
Labor_Force_Numwith the type Long, then calculate it with one of these expressions, which turn N/A into null:
Arcade:
IIf($feature.Labor_Force == 'N/A', null, Number($feature.Labor_Force))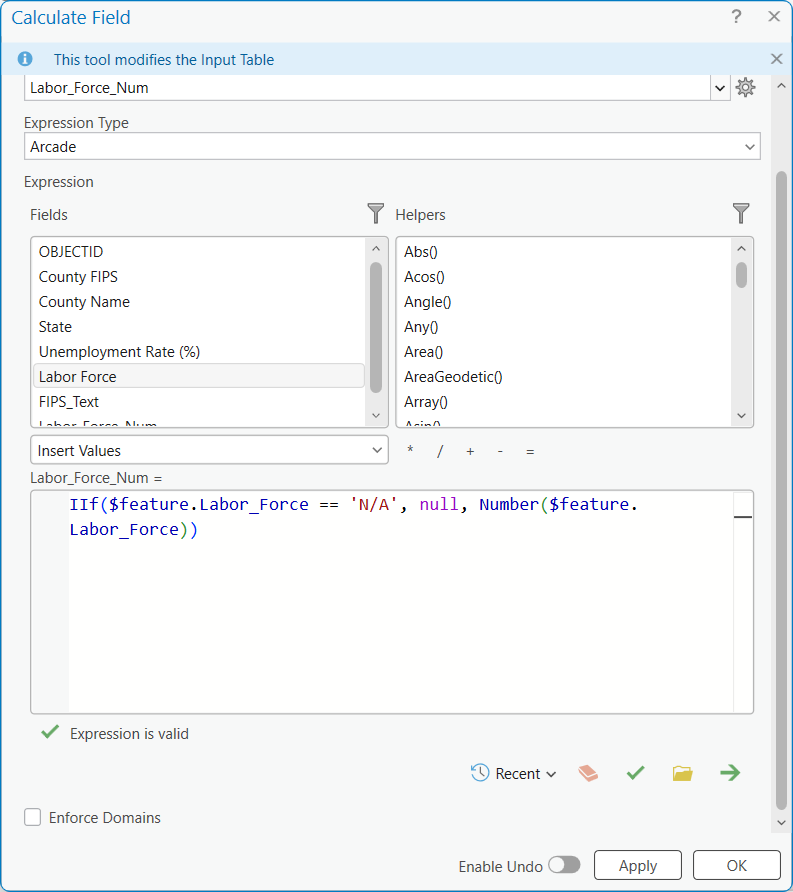
Python:
None if !Labor_Force! == 'N/A' else int(float(!Labor_Force!))In your own spreadsheets, leave cells empty when there’s no data instead of typing N/A.
Step 7: Join the fixed table
Now you can join the cleaned-up table to the counties layer.
- Remove any existing joins if necessary by selecting Joins and Relates > Remove All Joins (may not be necessary)
- Right-click the counties layer and choose Joins and Relates > Add Join.
- Set the Input Field to the FIPS field in the counties layer.
- Set the Join Table to
Messy_Data_Table. Make sure you pick the geodatabase table, notMessy_Data$from the Excel file. - Set the Join Table Field to
FIPS_Text. - Leave Keep all input records checked.
- Click Validate Join. All 64 counties should match.
- Click OK.
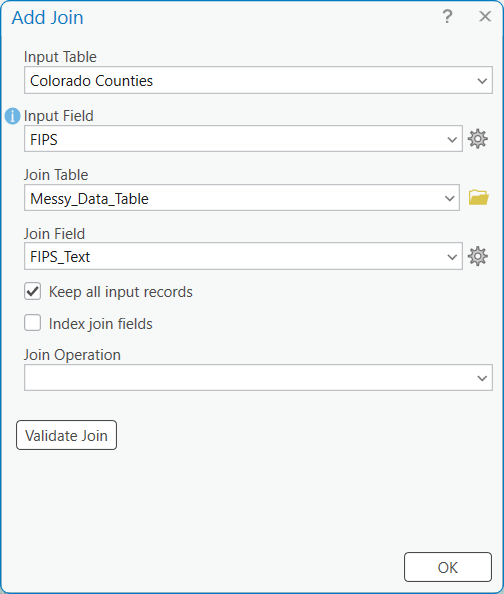
Open the attribute table and sort the joined Unemp_Rate field to check for nulls, the same way you did in Part 3. There shouldn’t be any.
Other spreadsheet problems to watch for
The Messy_Data sheet doesn’t include these, but you’ll see them in spreadsheets from other people:
- Merged cells. Unmerge them before bringing the sheet into ArcGIS Pro.
- Blank rows. Delete them. They can come in as empty records.
- Totals or notes below the data. Remove them, or they’ll come in as extra rows.
Part 5: When one county has several rows
Before you start, right-click the counties layer and choose Joins and Relates > Remove All Joins.
Sometimes your spreadsheet has more than one row per feature. The Multi_Year sheet has three rows for each county, one each for 2023, 2024, and 2025, for 192 rows in all.
The Add Join tool has a Join Operation option that controls what happens:
- Join one to first keeps only the first matching row. Each county gets one year’s values, and the other years are ignored. You may not get the year you wanted.
- Join one to many creates a separate record for every match. Each county appears three times in the attribute table, once per year, so 64 counties become 192 records.
Neither choice is wrong, but you should pick one on purpose. If you only want one year, the cleanest approach is to filter the table to that year first, then join.
Part 6: Make the join permanent
A join only lives in the map. If you remove the layer, share the data, or open it in another project, the joined fields are gone. There are two ways to keep them.
Export the joined layer. Right-click the layer and choose Data > Export Features. The new feature class includes all the joined fields as regular fields.
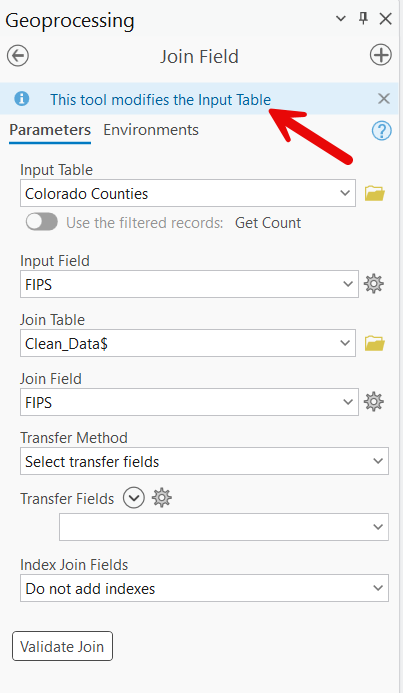
Use the Join Field tool. This tool from the Data Management toolbox writes fields from the table directly into your existing data. You can choose just the fields you need. Note that it changes the original data, so make a copy first if you aren’t sure. Also note: This will not work if you’re using the USA Counties layer that comes from ArcGIS Online Living Atlas. You’ll need a local feature class or shapefile.
Quick checklist when a join fails
- Did you click Validate Join first?
- Are both join fields the same type, text to text or number to number?
- Did FIPS or other codes lose their leading zeros?
- Are there extra spaces before or after the values?
- Are you joining on a code instead of a name?
- Is there a title row, merged cells, or text in a number column?
- After the join, how many nulls are there, and do they make sense?
Most failed joins come down to one of these. Once you’ve fixed a few, you’ll start spotting them before you run the join.
Want to go deeper on field types and setting up your data the right way? Our Introduction to the Geodatabase in ArcGIS Pro class covers it in detail, and it’s included in the Annual GIS Training License.
