
You add a layer to your map, run a tool, and get back 12 features instead of the 400 you expected. Or you hand off a project to a coworker, and they can’t figure out why half the data seems to be missing. In most cases, the cause is a filter someone forgot about, or the wrong kind of filter for the job.
ArcGIS Pro gives you several ways to work with just part of a layer. The three you’ll use most are definition queries, selections, and ranges. They look similar at first, since each one narrows down what you see, but they behave differently and are meant for different jobs.
In this article, we’ll walk through all three using the USA Current Wildfires layer from ArcGIS Living Atlas. It’s a good dataset for this because it’s free, it updates often, and it has useful fields like fire size, percent contained, and state.
Getting set up
To follow along, open a new map in ArcGIS Pro. On the Map tab, click Add Data, choose Living Atlas, and search for “USA Current Wildfires.” Add the layer to your map.
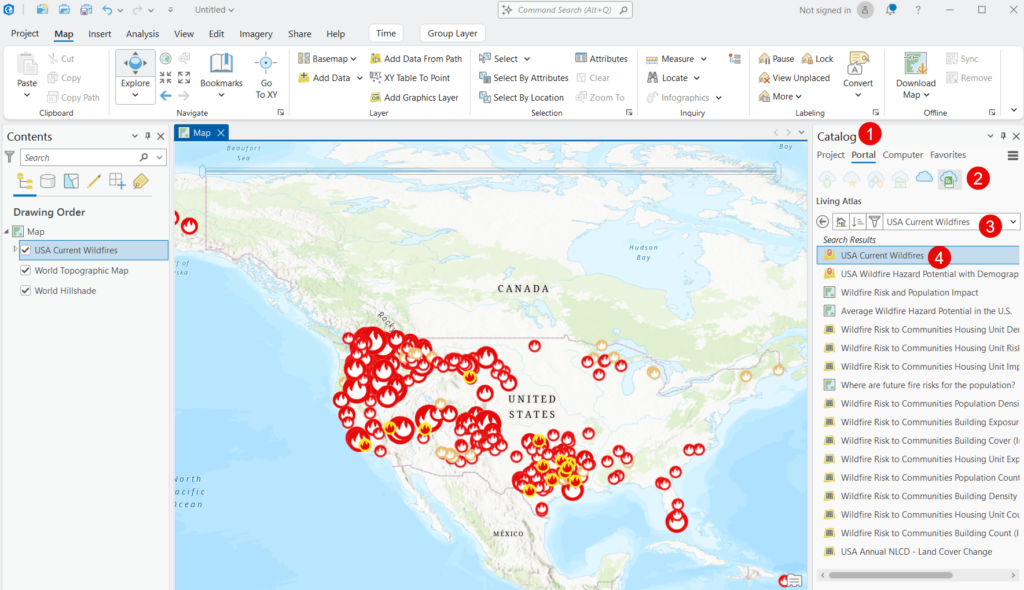
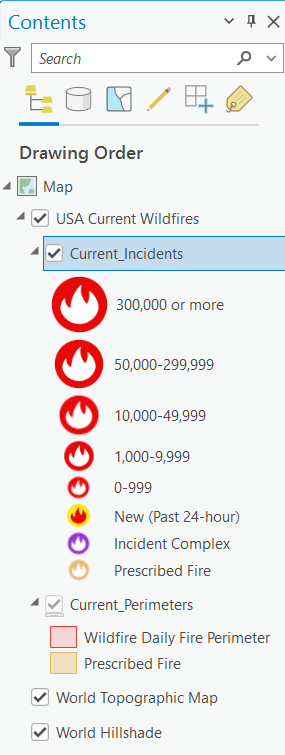
The layer comes in as a group with two sublayers: one for fire incidents (points) and one for fire perimeters (polygons). We’ll work with the incidents layer in this article. It includes fields such as:
- IncidentName, the name of the fire
- IncidentTypeCategory, a short code for the type of incident: WF for wildfire, RX for prescribed fire, and CX for an incident complex
- DailyAcres, the reported size of the fire
- PercentContained, how much of the fire is contained
- POOState, the state where the fire started
- FireDiscoveryAge, the number of days since the fire was discovered
Keep in mind that this is live data. Your numbers won’t match the ones in the screenshots, and that’s fine.
The quick answer
If you only have a minute, here’s the short version:
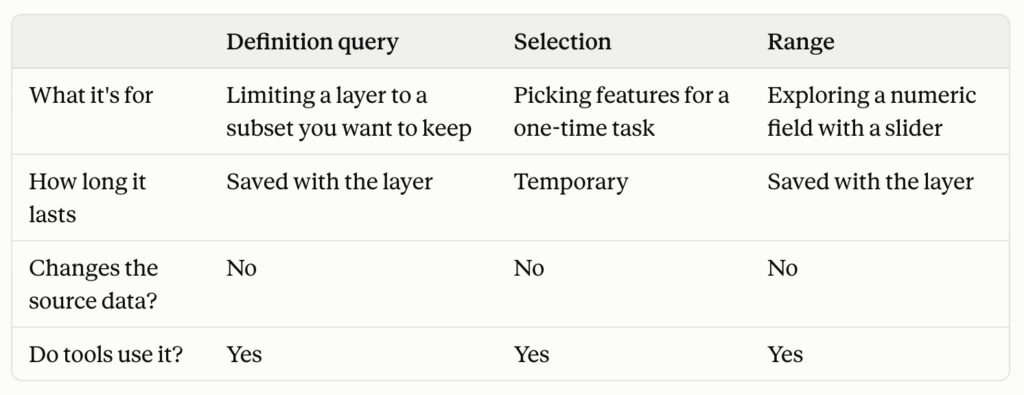
A simple rule of thumb: use a definition query for “always,” a selection for “right now,” and a range for “let me explore.”
Definition queries: “Only ever show me this”
A definition query tells a layer to act as if certain features don’t exist. Features that don’t match the query disappear from the map and the attribute table, and geoprocessing tools skip them. Nothing is deleted from the source data. The layer just ignores whatever doesn’t match.
Example: show only wildfires
The incidents layer includes prescribed burns and incident complexes along with regular wildfires. Say you’re building a map that should only ever show wildfires.
- Expand the USA Current Wildfires group layer
- Right-click the Current_Incidents layer and choose Properties.
- Click the Definition Query tab.
- You should see an existing definition query that displays features if DailyAcres > 0.1 (this default query eliminates the smallest fires from display)
- Click New definition query.
- Build the clause: IncidentTypeCategory is equal to WF.
- Click Apply, then OK.
- Rename the definition query “Only Wildfires” by clicking Query 2 and typing in the name.
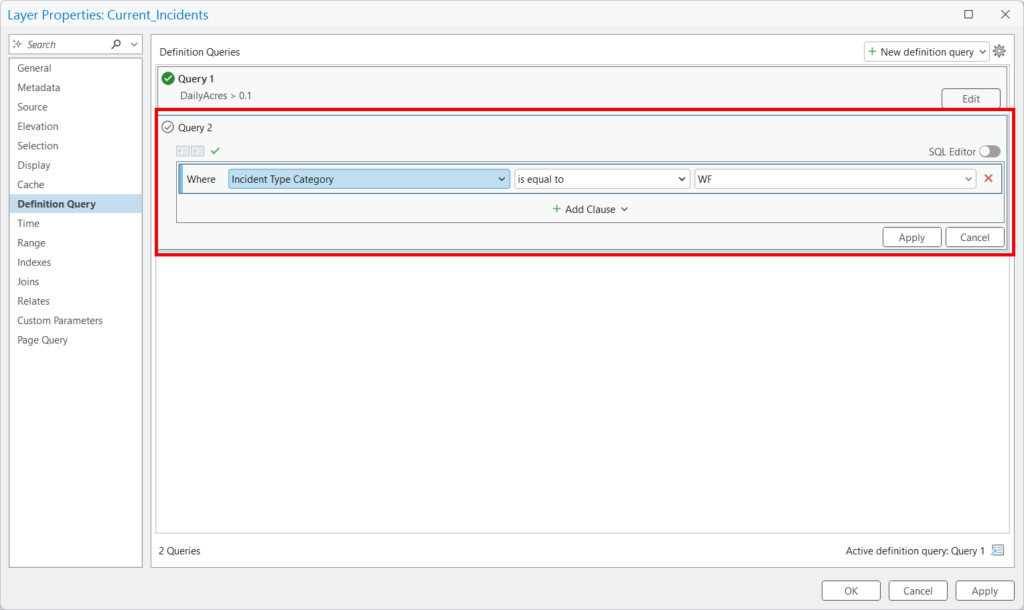
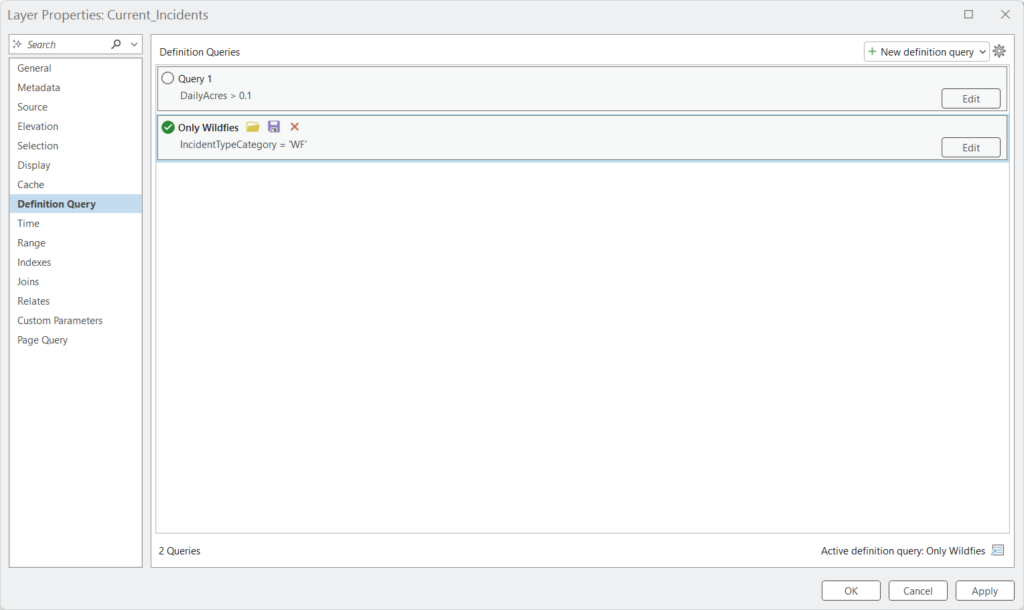
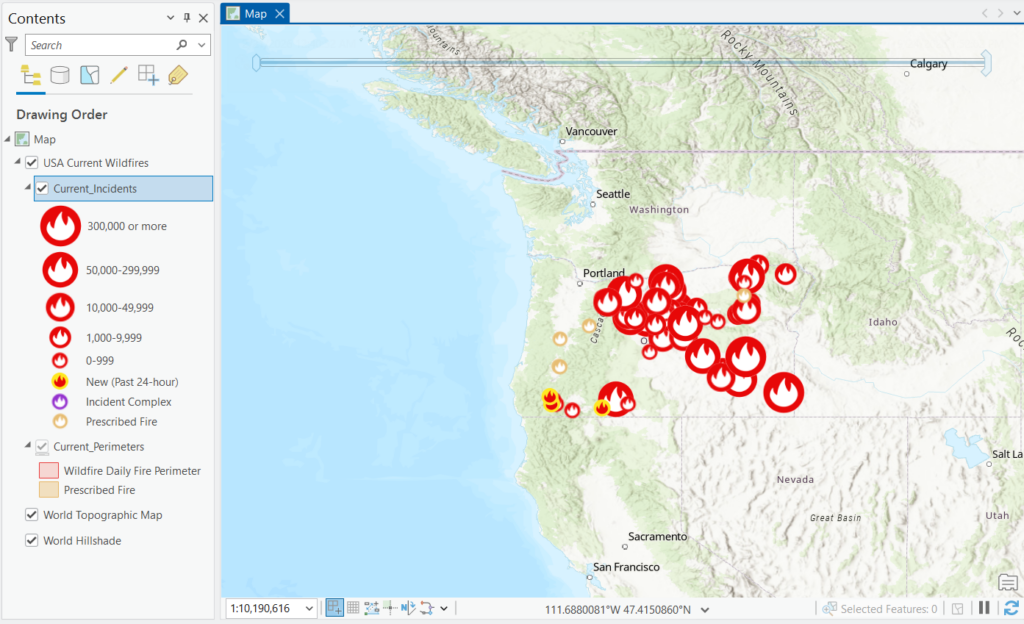
The prescribed fires and complexes drop off the map. Open the attribute table and you’ll see the record count has gone down too.
Add and activate a third definition query that displays only wildfires where the origin state is Oregon as seen below.
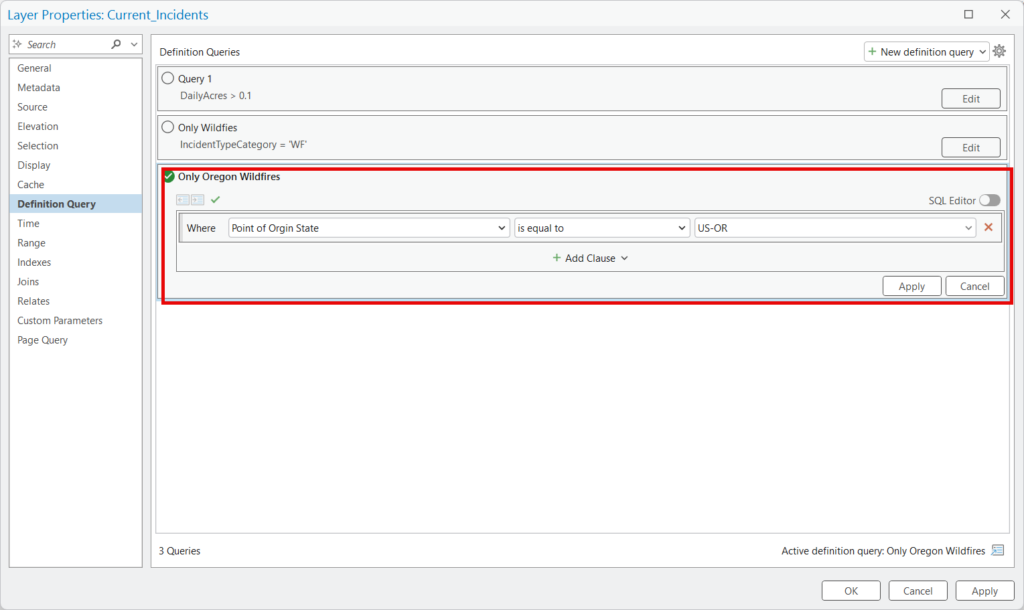
Saving more than one query
You can save several definition queries on the same layer, but only one can be active at a time. For example, you could save one query for wildfires only and another for fires in a single state, then switch between them in Layer Properties without rebuilding anything.
A tip specific to this layer: if you want to filter by how recent a fire is, use the FireDiscoveryAge field (for example, FireDiscoveryAge is less than or equal to 3) instead of building a query on the date fields. The layer’s publisher recommends the “age” fields because the service handles those queries more efficiently.
When to use it
Use a definition query when the subset is something you’ll want every time you open the map, such as active permits, open work orders, or wildfires only. It’s also the right choice when you’ll share the map, because the query travels with the layer.
Watch out for
The most common problem is forgetting a definition query is there. You come back to a project weeks later, and the data looks incomplete. If a layer seems to be missing features, check the Definition Query tab first.
Selections: “Just these features, just for now”
A selection highlights specific features without hiding the rest. Everything stays on the map and in the attribute table; the selected features are simply marked in a different color.
Selections are meant to be temporary. You make one, do something with it, and clear it.
Ways to select
- Interactively, using the Select tool on the Map tab and clicking or drawing a box on the map
- Select By Attributes, which picks features based on values in the table
- Select By Location, which picks features based on where they are in relation to another layer
Example: find the largest fires
Say you want to export the fires that have burned 10,000 acres or more.
- First, activate the Query 1 definition query on the Current_Incidents layer so that we reset the display to what was originally applied.
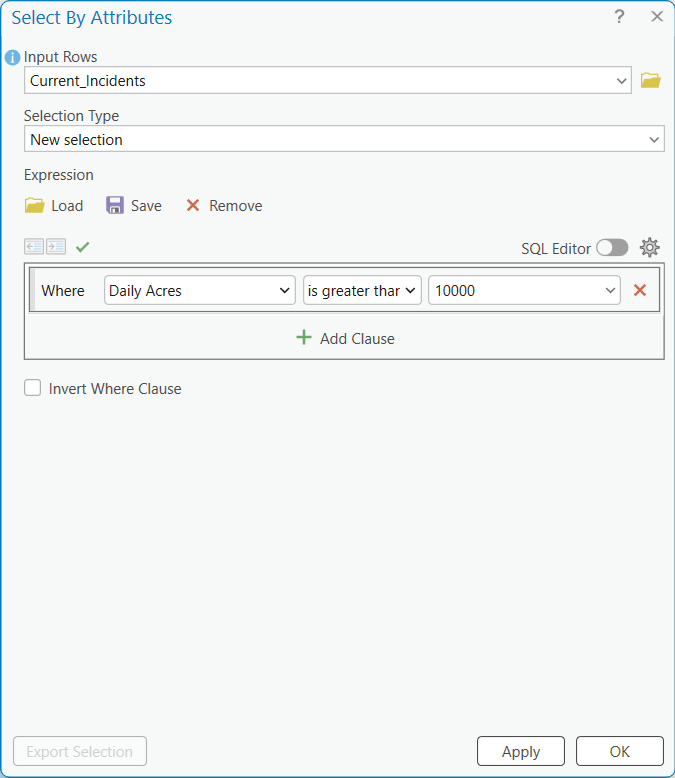
- On the Map tab, click Select By Attributes.
- Set the input layer to the Current_Incidents layer.
- Build the clause: DailyAcres is greater than or equal to 10000.
- Click OK.
The large fires are highlighted on the map. Open the attribute table and click Show selected records to see only those rows.
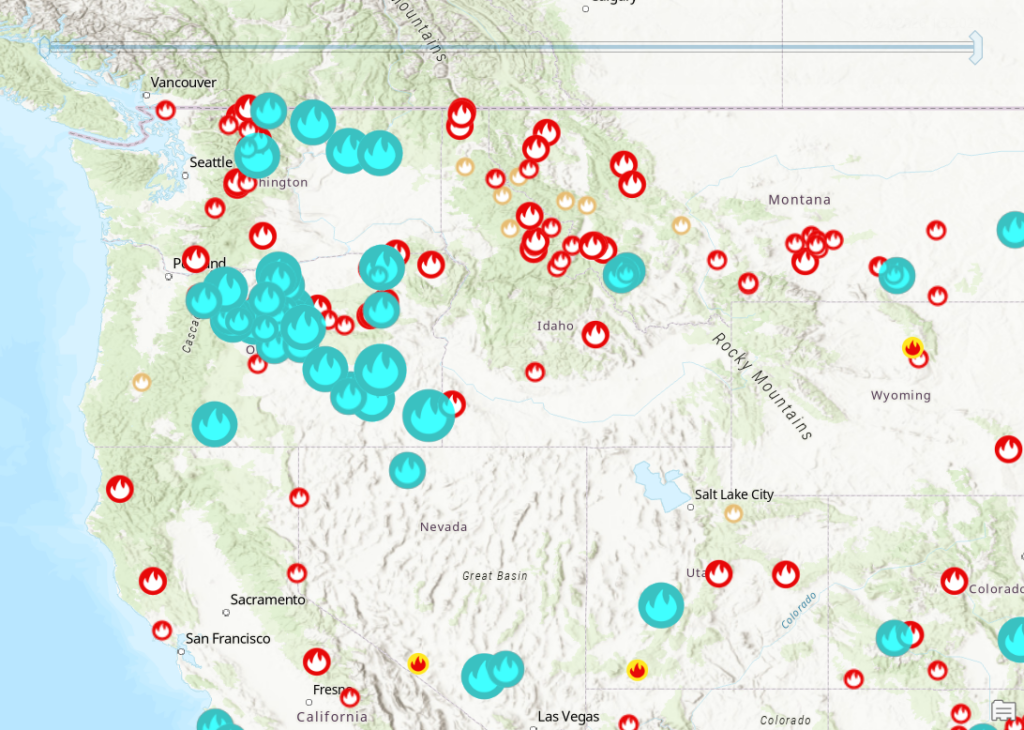
Now, if you right-click the layer and choose Data > Export Features, only the selected fires will be exported. The same is true for most geoprocessing tools and for Calculate Field.
When to use it
Use a selection for one-off tasks: exporting a few records, updating an attribute on a handful of features, or running a tool on a specific group of features.
Watch out for
This is where the “why did my tool only process 12 features?” problem comes from. If a layer has an active selection, most tools will only run on the selected features. Before running a tool, glance at the selection count at the bottom of the map view or in the attribute table header. To clear a selection, click Clear on the Map tab.
One more thing: selections work inside definition queries. If your layer has a wildfires-only query and you select fires over 10,000 acres, you’ll only get wildfires over 10,000 acres.
Range: “Let me explore this”
A range adds a slider to the map for a numeric field. As you drag the slider, features outside the current range disappear and features inside it appear. It’s a quick way to explore patterns without writing a new query each time.
Setting up a range takes two steps: first you define the range in Layer Properties, then you turn it on from the Range tab on the ribbon. The second step is easy to miss, and without it, the slider never shows up.
Example: explore fires by containment
Say you want to see which fires are barely contained and which are nearly out.
Step 1: Define the range
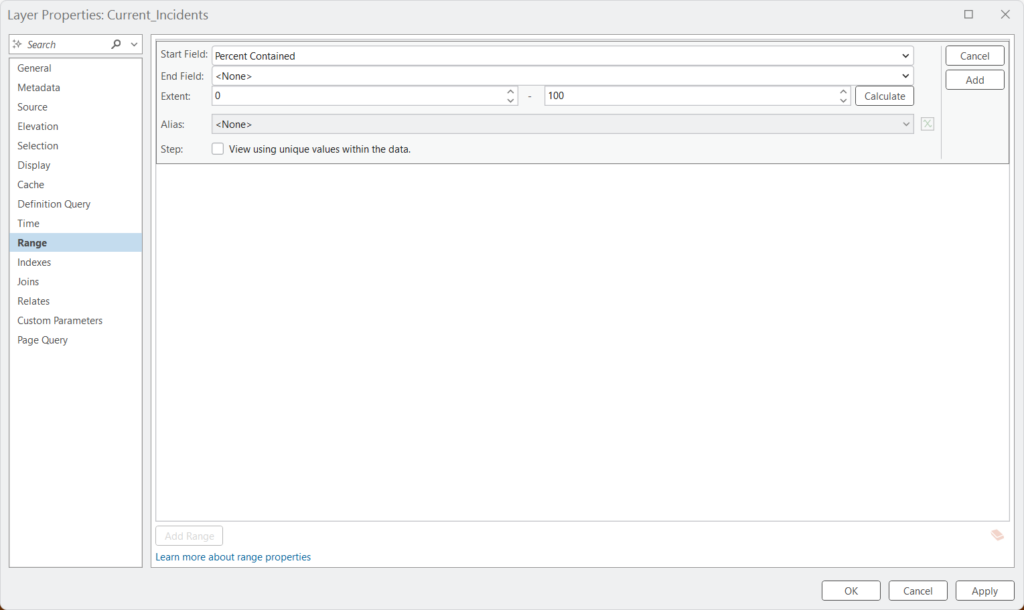
- Right-click the Current_Incidents layer and choose Properties.
- Click the Range tab, then click Add Range.
- For Start Field, choose Percent Contained.
- Leave End Field set to None. You only need an end field when your data stores a starting and ending value in two separate fields, like a beginning and ending year.
- Check the Extent. Pro fills it in when you pick the field. Percent Contained runs from 0 to 100, so the extent should read 0 to 100. If it looks wrong, click Calculate so Pro reads every record instead of a sample.
- Leave Step unchecked for now. If you check it, the slider moves between values that actually exist in the data instead of moving in even steps.
- Click Add.
- Click Ok.
Step 2: Turn the range on
When you close Layer Properties, a Range tab appears on the ribbon. At this point, the range is defined, but it isn’t active yet, so you won’t see a slider.
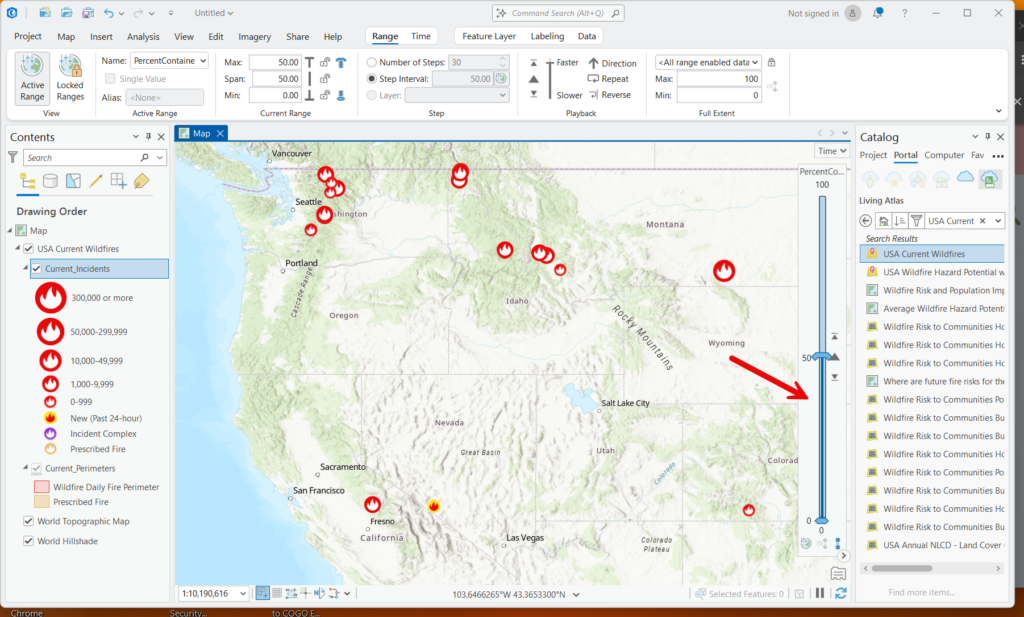
- Click the Range tab on the ribbon.
- In the Active Range group, open the Name dropdown and choose Percent Contained.
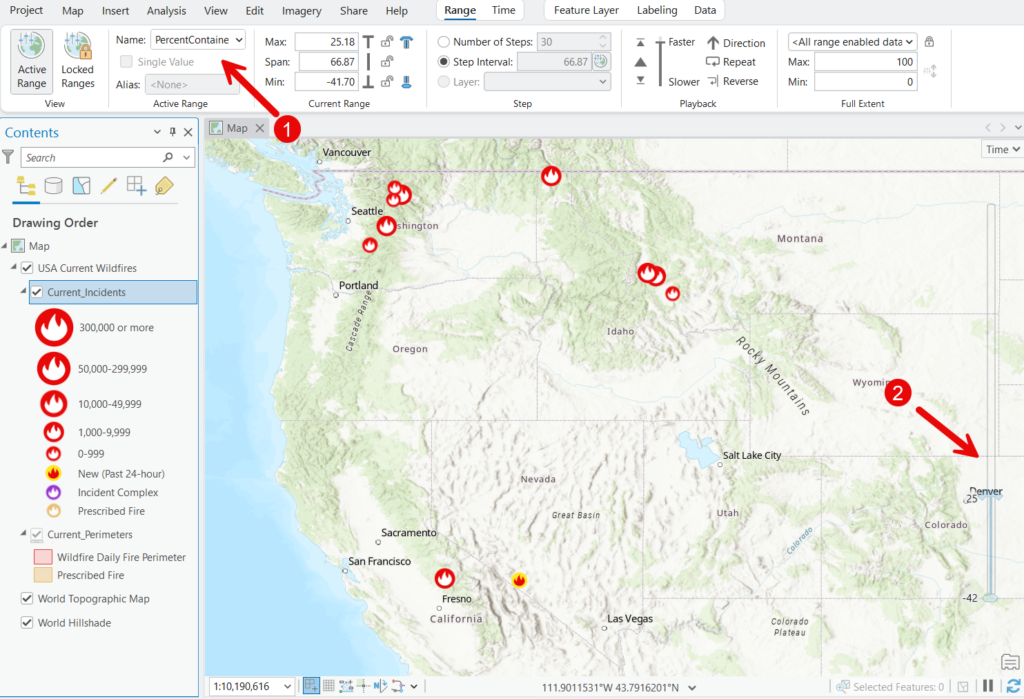
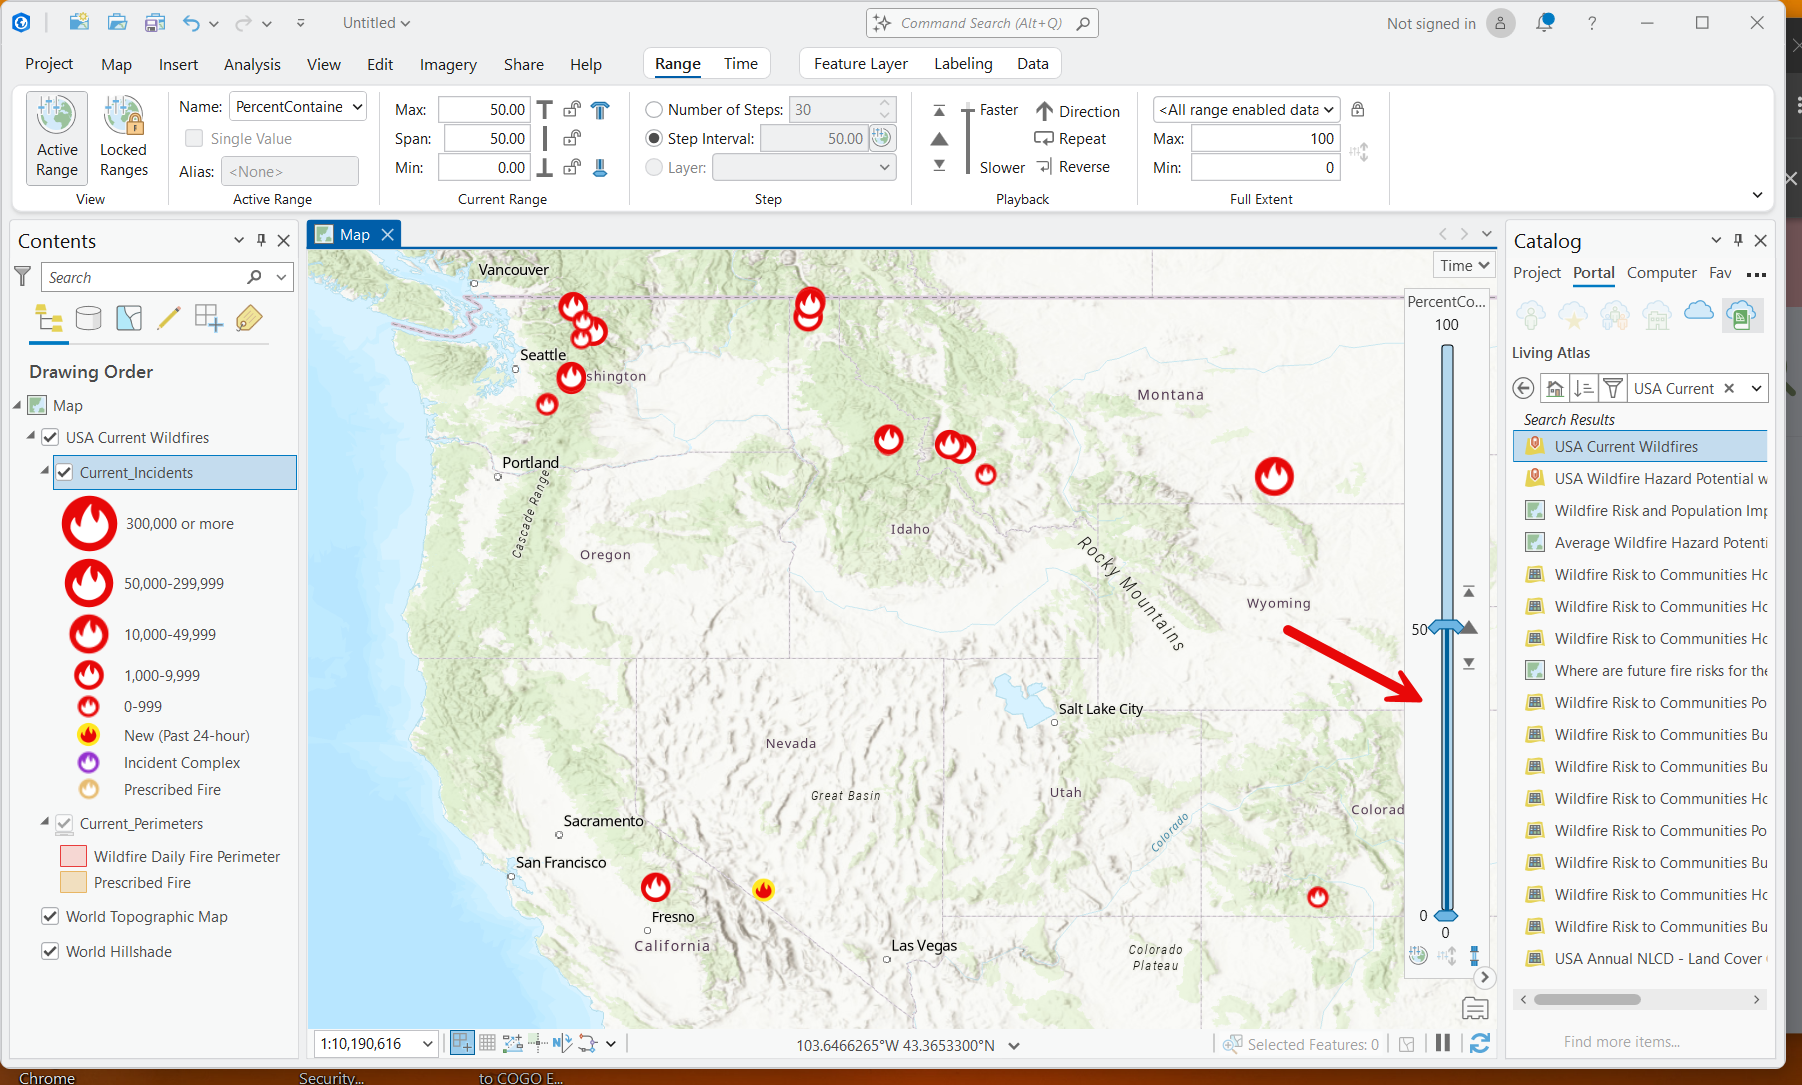
The controls on the Range tab become active, and the range slider appears along the right side of the map. Look closely, because the slider is nearly see-through when you aren’t using it. Move your pointer toward the right edge of the map to bring it into full view.
Step 3: Explore
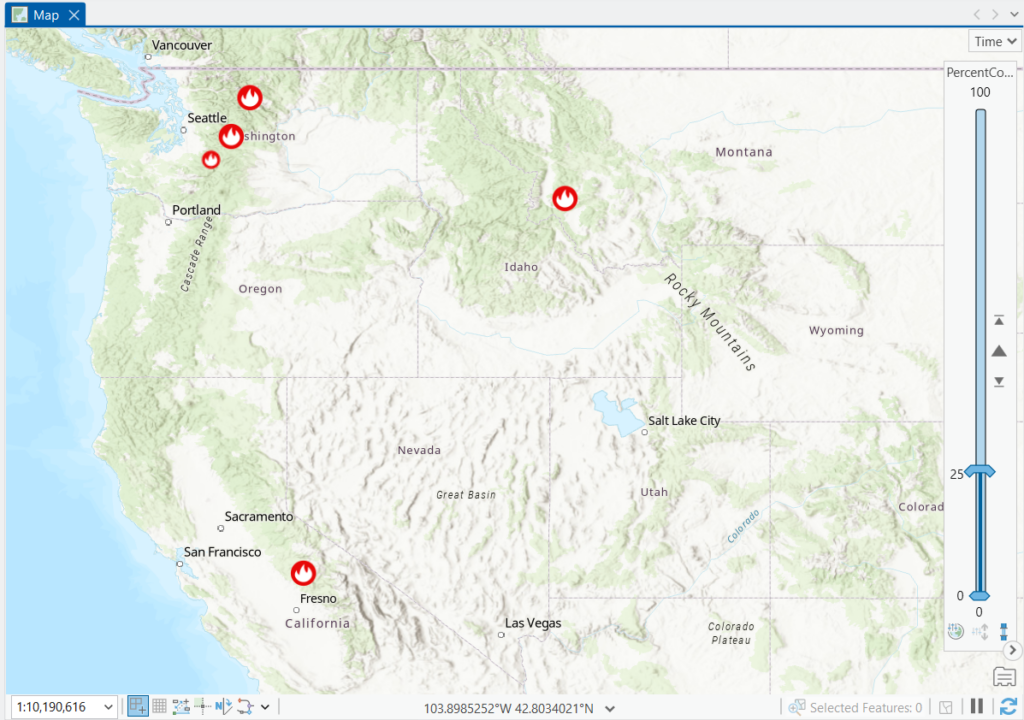
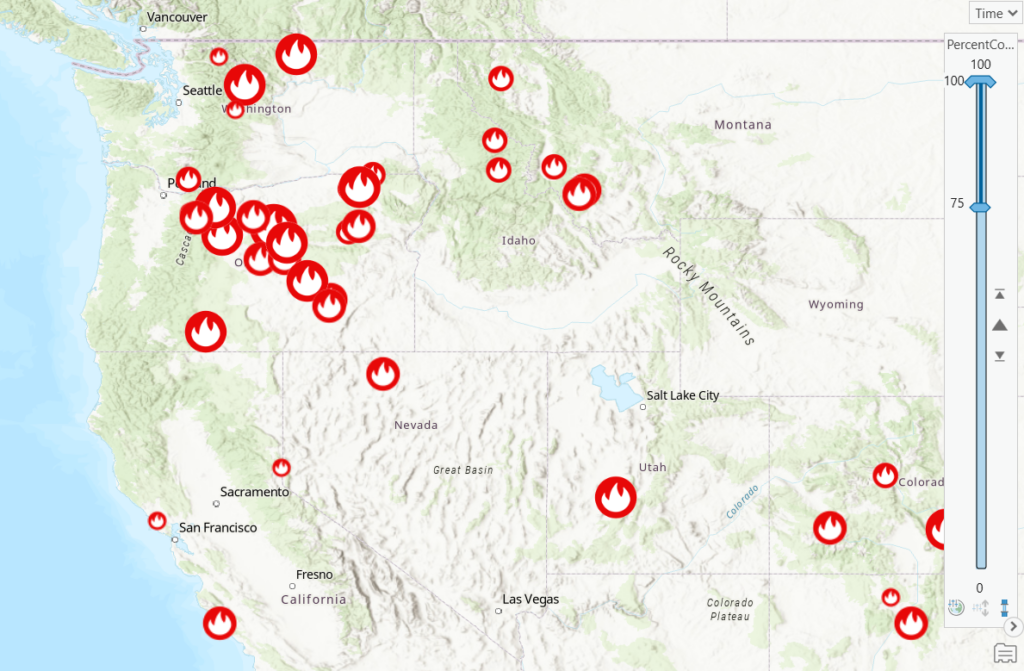
Drag the slider handles to show only fires that are 0 to 25 percent contained. Then slide the range up toward 100 and watch the map change as you move to fires that are nearly out. You can also type exact values in the Max and Min boxes in the Current Range group on the ribbon.
More than one range
You can define more than one range on a layer, such as one for Percent Contained and one for Daily Acres, but only one can be active at a time. Switch between them with the Name dropdown on the Range tab. The field has to be numeric. For date fields, use the time slider instead.
Don’t confuse it with the time slider
The wildfire layer also has time turned on, so you may see a Time button in the upper-right corner of the map. That controls a separate slider based on fire discovery dates. It has nothing to do with the range you just set up.
When to use it
Use a range when you’re exploring data or presenting it to someone. It works well for questions like “Where are the big fires?” or “Which fires are nearly contained?” when you want to try different values quickly.
Watch out for
It’s easy to think of a range as just a display setting, but it’s more than that. Geoprocessing tools honor the current range, just as they honor a definition query. If you leave the slider set to 0–25 percent and run a tool, the tool will only see those fires. When you’re done exploring, set the Name dropdown back to <None> or turn the range off with the Active Range button on the Range tab.
Honorable mention: display filters
There’s a fourth option that often gets mixed up with the other three: display filters. These are set on the Display Filters tab in Layer Properties, and they only control what draws on the map.
The difference is important. With a display filter, the hidden features are still in the attribute table, can still be selected, and are still used by geoprocessing tools. They just aren’t drawn. Display filters are handy for keeping a busy map readable at certain scales, for example showing only large fires when zoomed out to the whole country, while keeping all the data available for analysis.
Which one should I use?
Here are a few common situations and the best fit for each:
- “I only ever want wildfires on this layer, not prescribed burns.” → Definition query
- “I need to export the five largest fires in California.” → Selection
- “I want to show my team how fires break down by containment.” → Range
- “My national map is too cluttered with small fires, but I still need them in my analysis.” → Display filter
- “I’m sharing this map, and it should always show only fires in my state.” → Definition query
Wrapping up
All of these tools narrow down your data, but they answer different questions. A definition query decides what a layer contains. A selection picks features for a task. A range lets you explore. And a display filter only changes what’s drawn.
When something looks off, such as missing features or a tool that processed fewer records than expected, check all of them. Look at the Definition Query tab, look for an active selection, and see if a range is turned on. One of them is usually the answer.
If you want to go further with filtering, querying, and analysis in ArcGIS Pro, our Introduction to GIS Analysis in ArcGIS Pro class covers these tools in hands-on exercises, and it’s included in the Annual GIS Training License.
