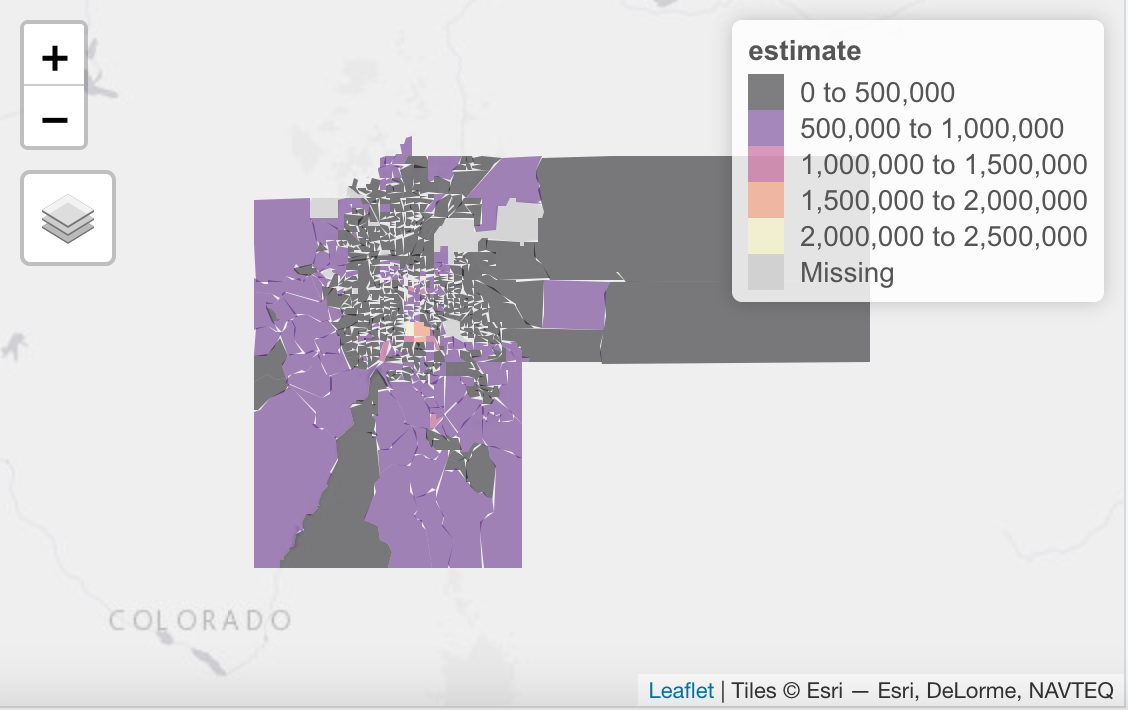
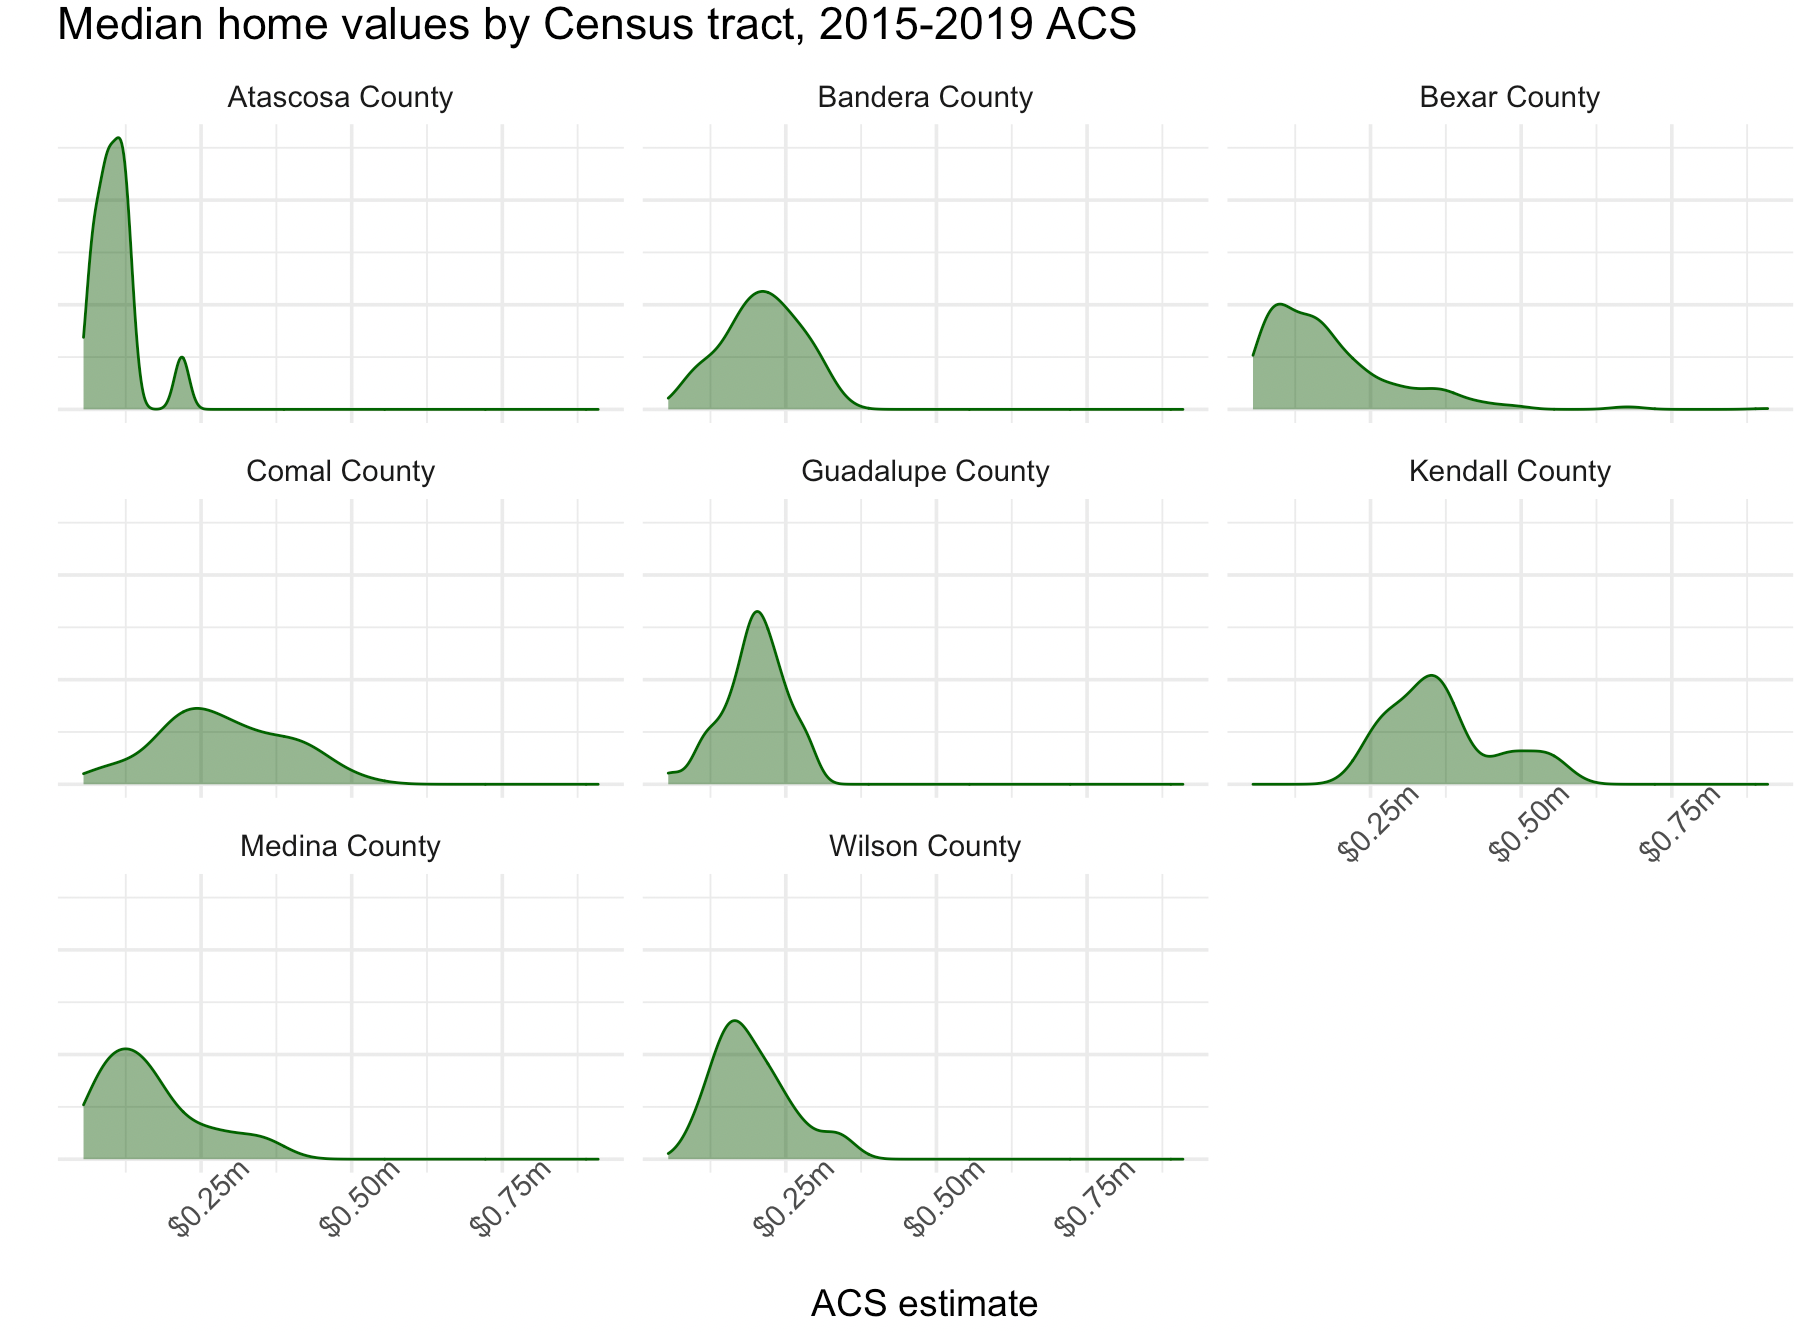
Visualizing Home Values in Texas with R
Many of our readers regularly work with U.S. Census data for mapping and analysis purposes. Whether you work with these datasets every day or just every now and then to create a map or graph you’ve no doubt discovered how difficult it can be to decipher census table...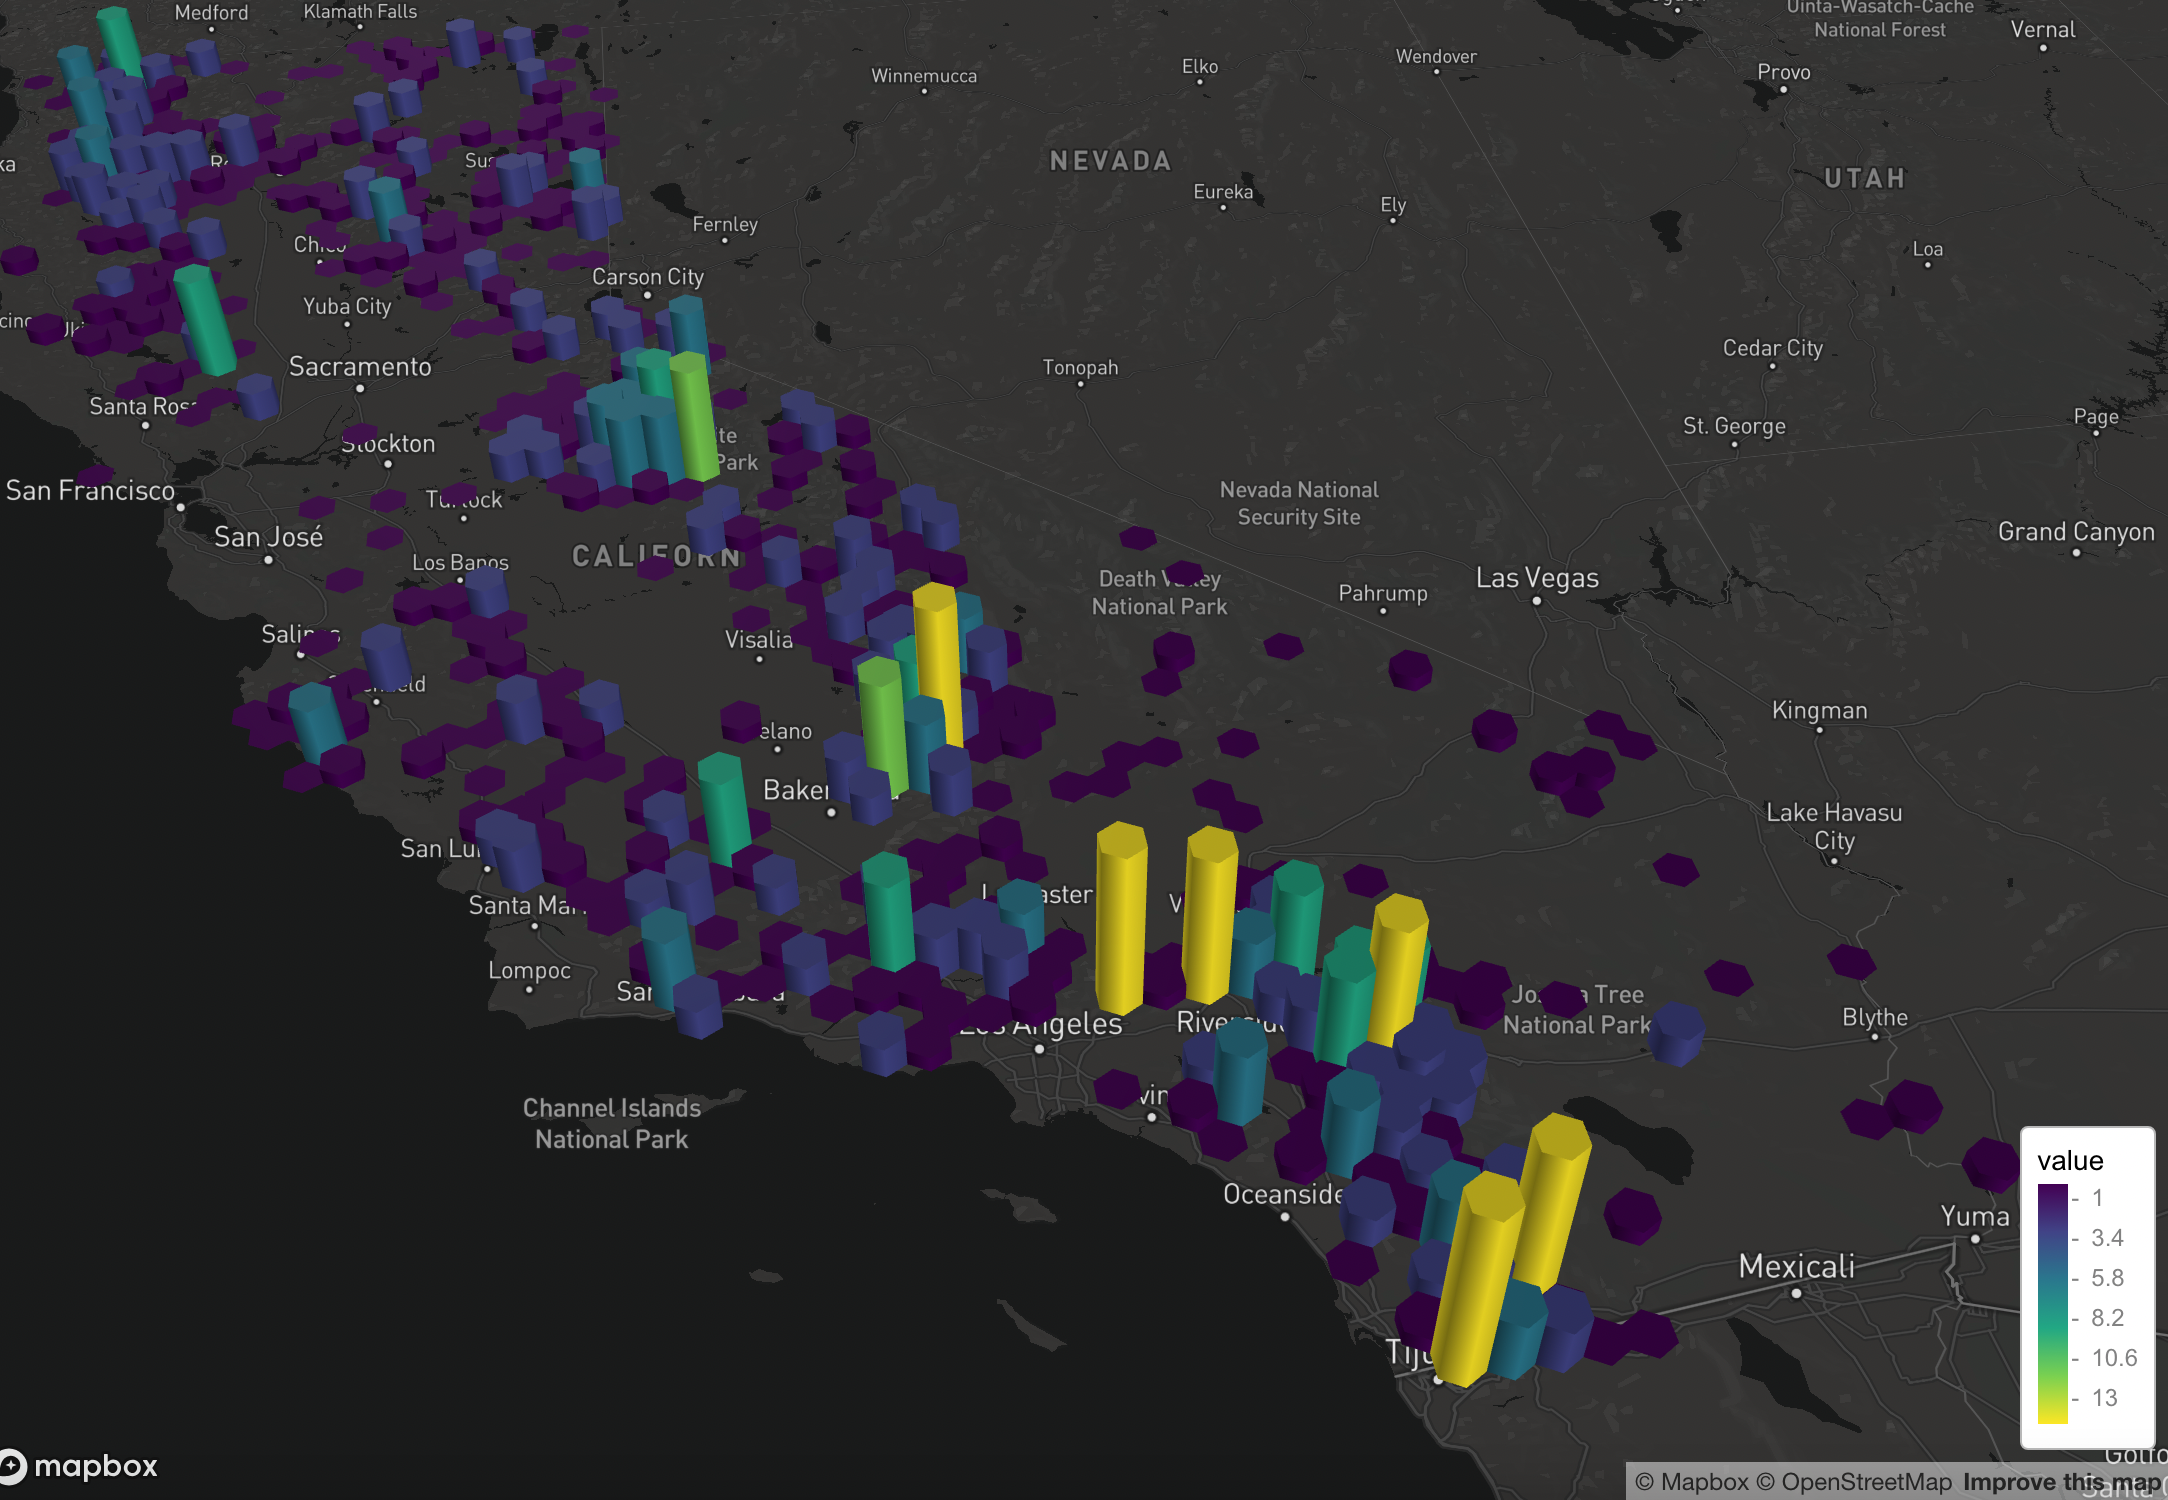
Visualizing California Wildfire Activity with R
From 2011 to 2020, there was an average of 62,805 wildfires annually and an average of 7.5 million acres impacted annually. In 2020, 58,950 wildfires burned 10.1 million acres, the second-most acreage impacted in a year since 1960; nearly 40% of these acres were in...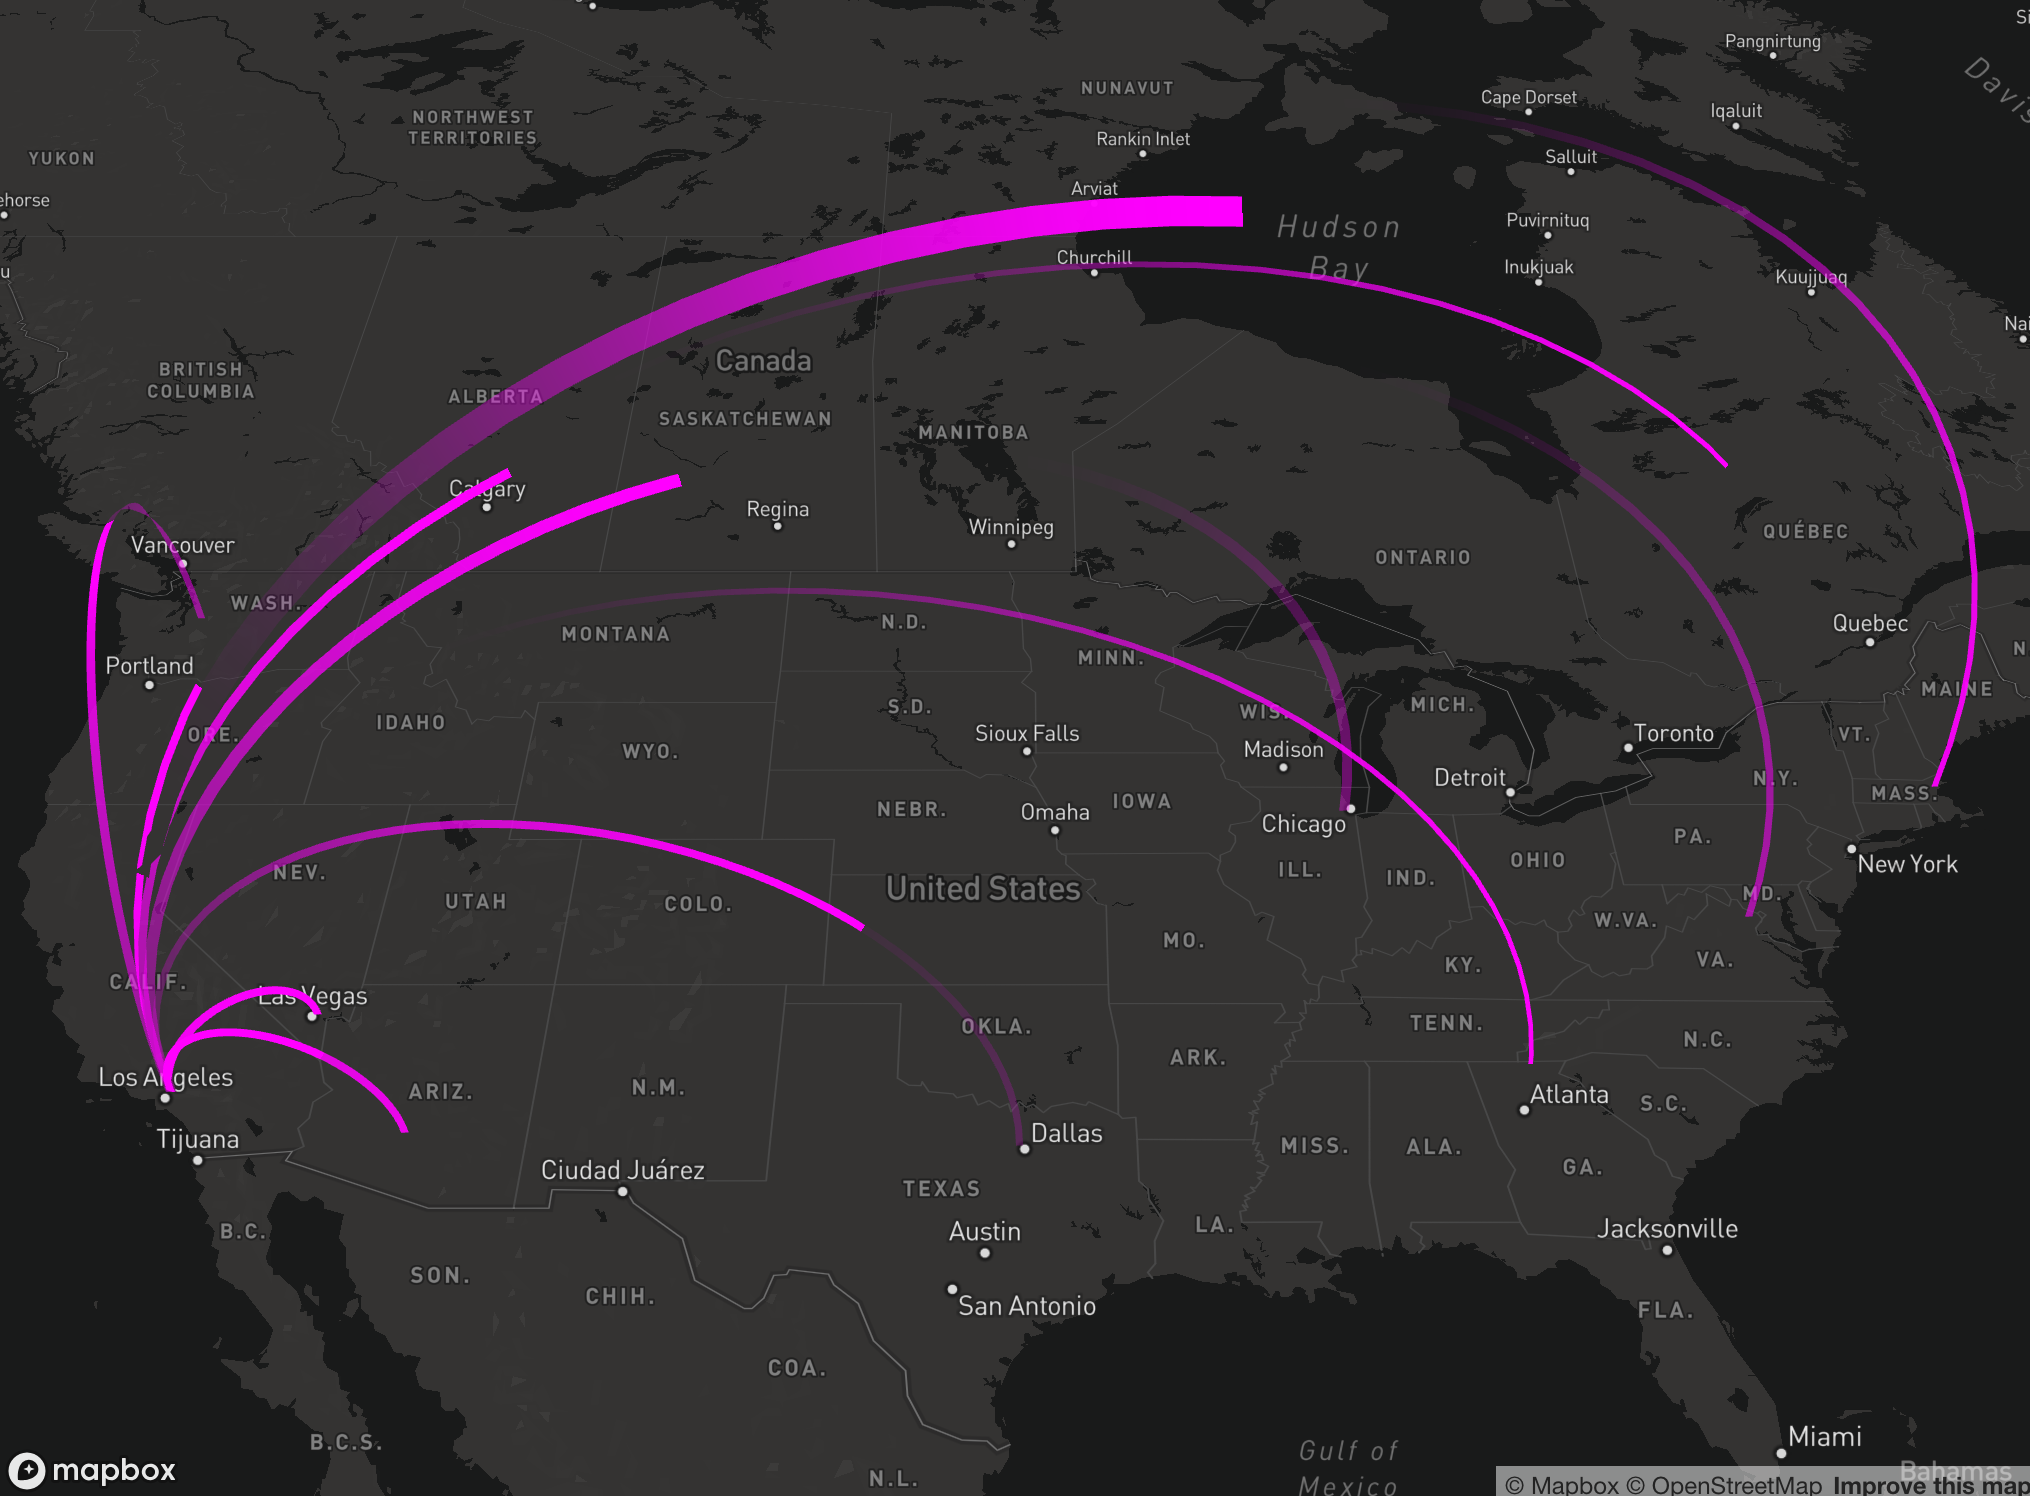
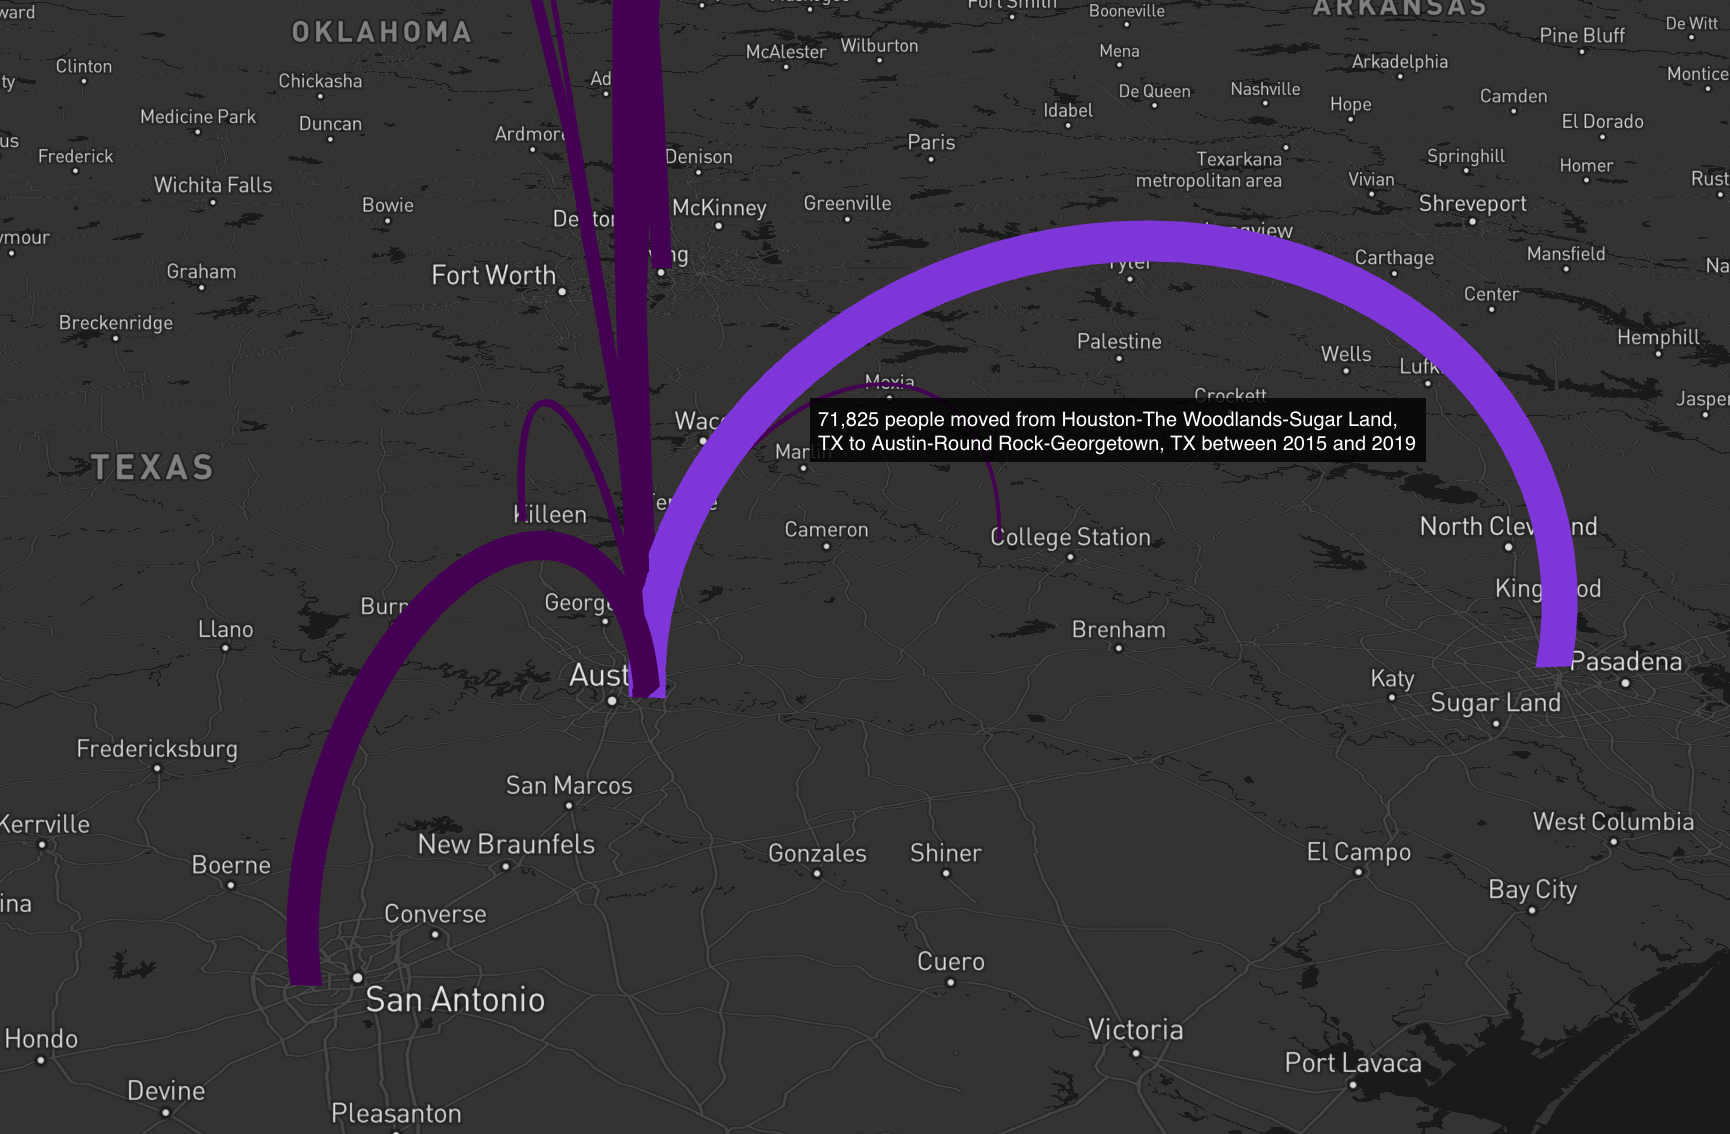
Leaving Los Angeles Flow Map
Flow maps, like the one you see below, provide a great way of visualizing the movement of variables between an origin and a destination. 2021 saw a 20% rise in movers for the year compared to 2020, with an estimated 56% of Americans moving in 2021 while just...
Creating Animated Maps with R
Animated maps, like the one you see below, provide a powerful enhancement to show how data evolves over time. In this tutorial you’ll learn how to use R with the ggmap, tidyverse, and gganimate libraries to produce animated maps like you see below. This animated...