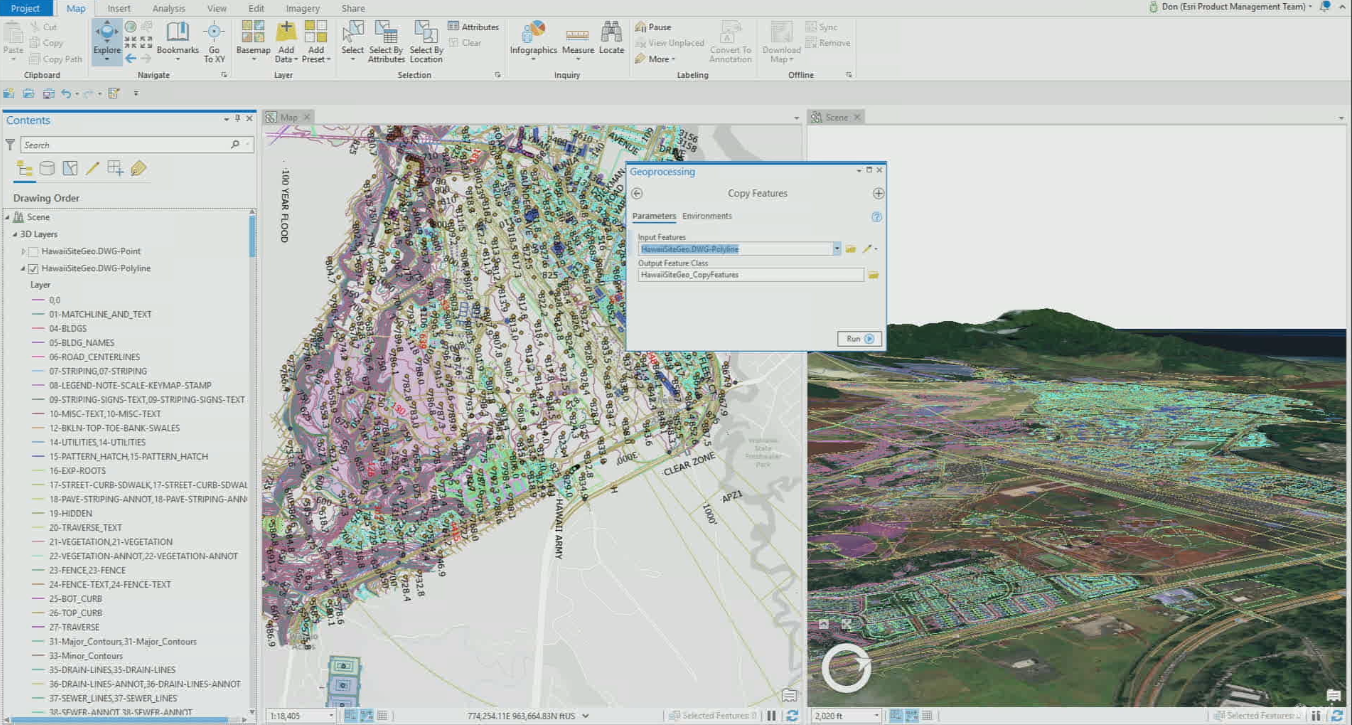
Modifying Existing Features and Attributes with ArcGIS Pro
All tools for modifying existing features can be found in a single editing pane in ArcGIS Pro. Editing attribute information happens inside an attribute table, where geoprocessing tools can help you save time populating fields with attribute data. Tools for modifying...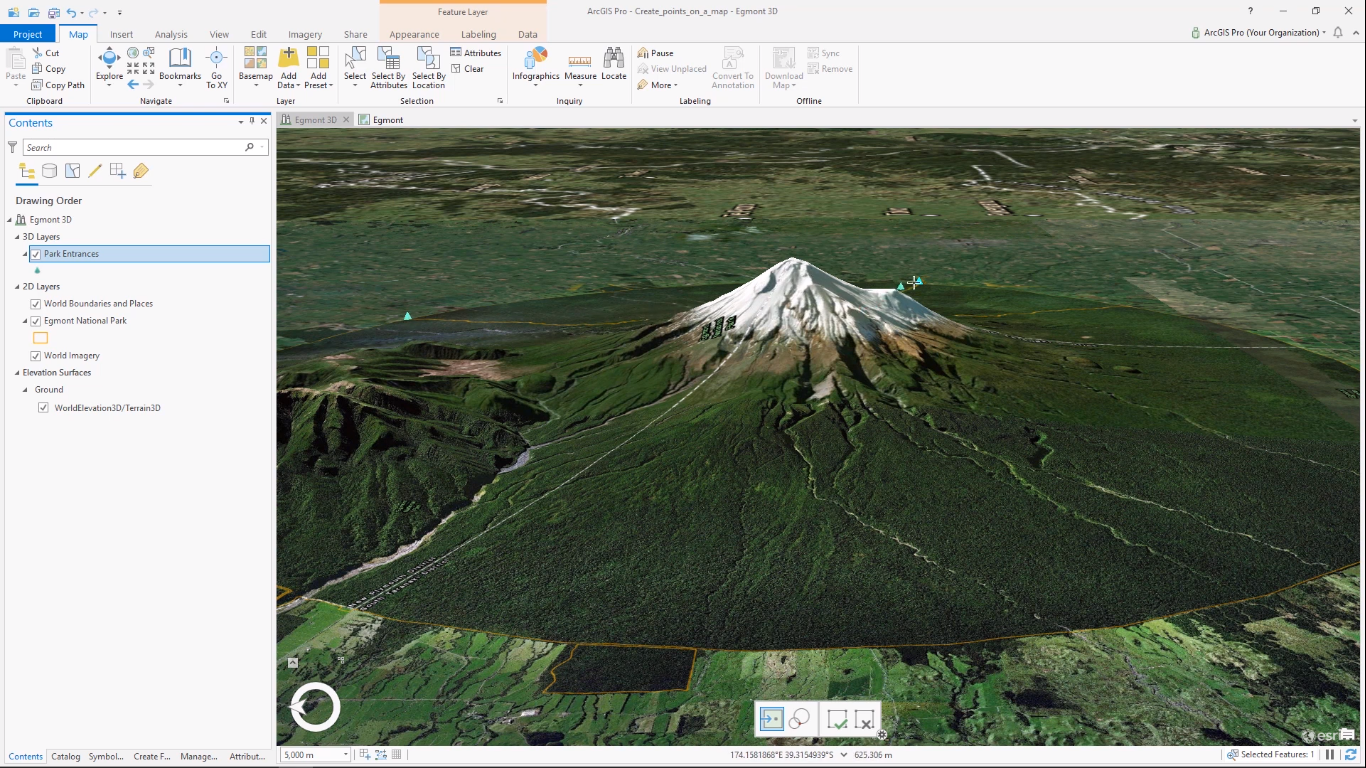
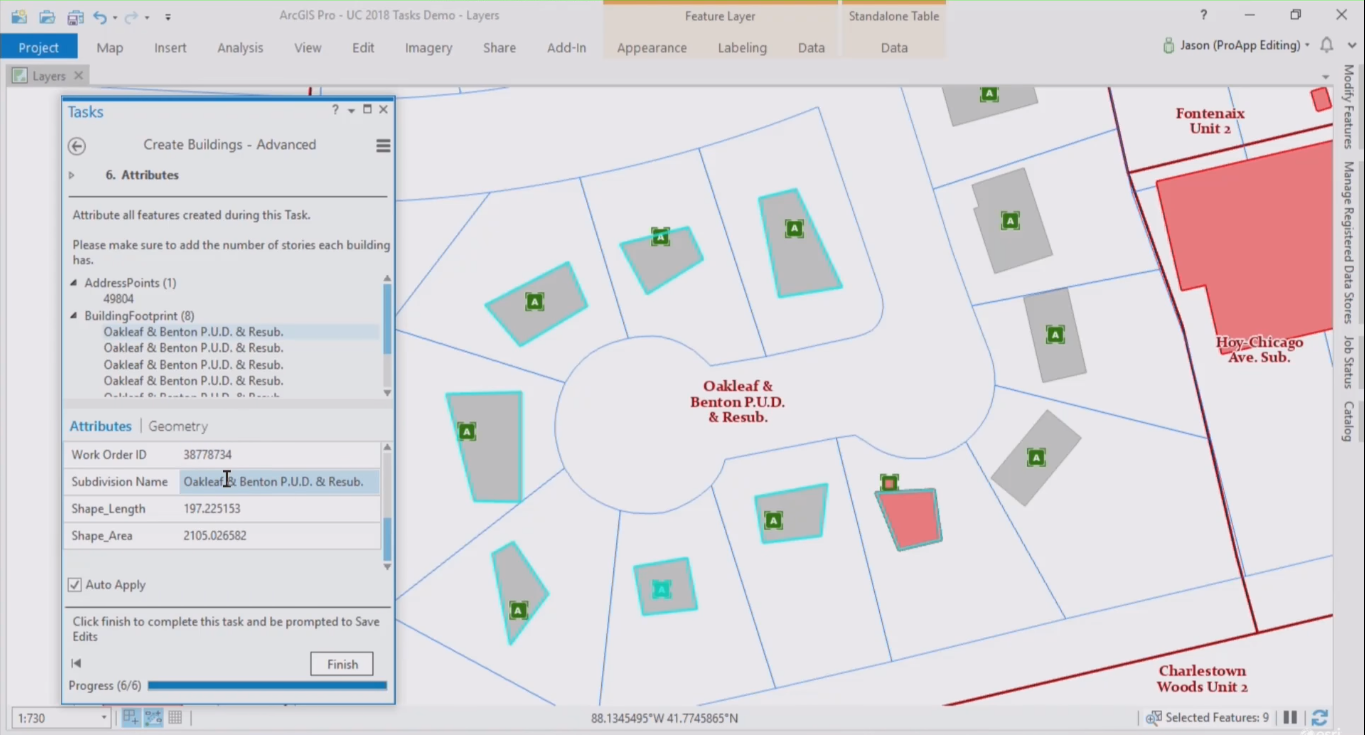
Editing in ArcGIS Pro: Creating New Features
New point, line and polygon features can be created using ArcGIS Pro. Multiple construction menus assist the user to sketch new features in the map window, while tabs in the content pane enable control over which layers can or cannot be edited. Creating a new feature...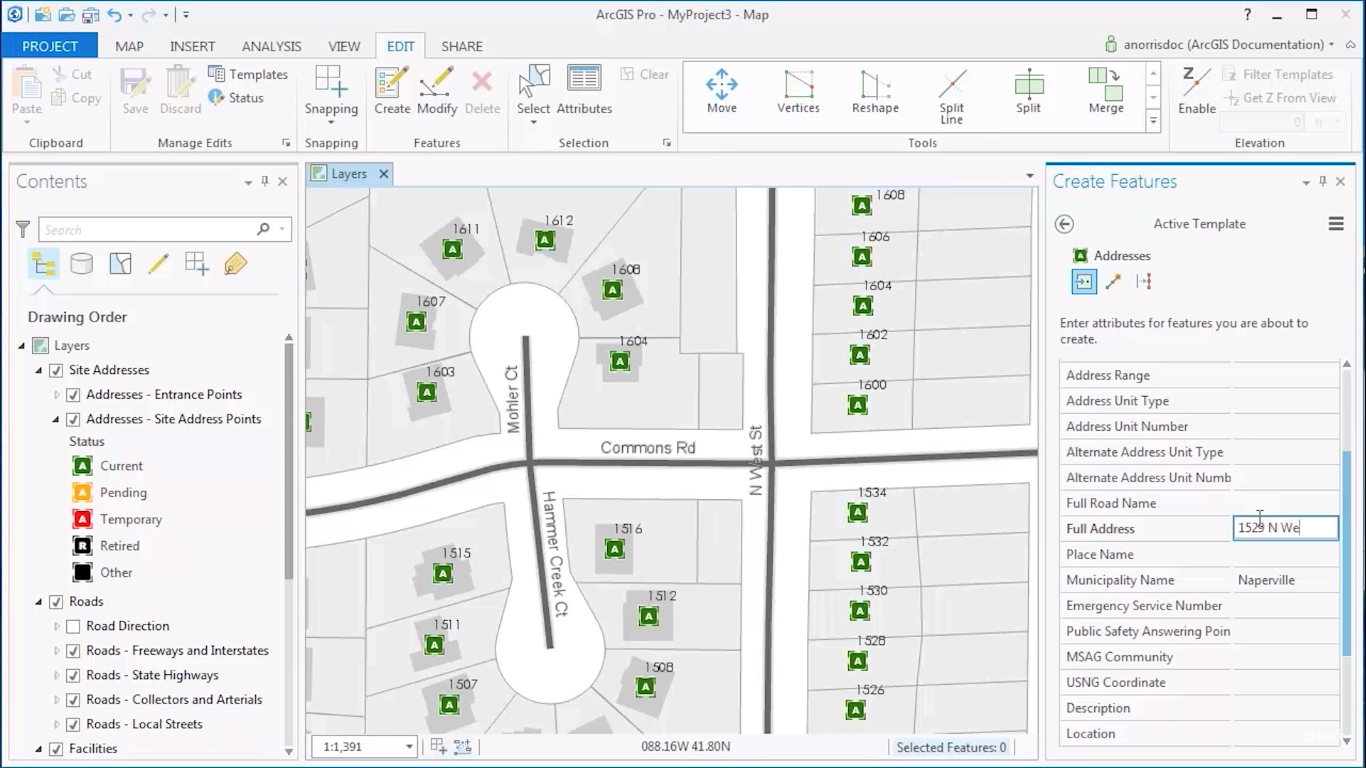
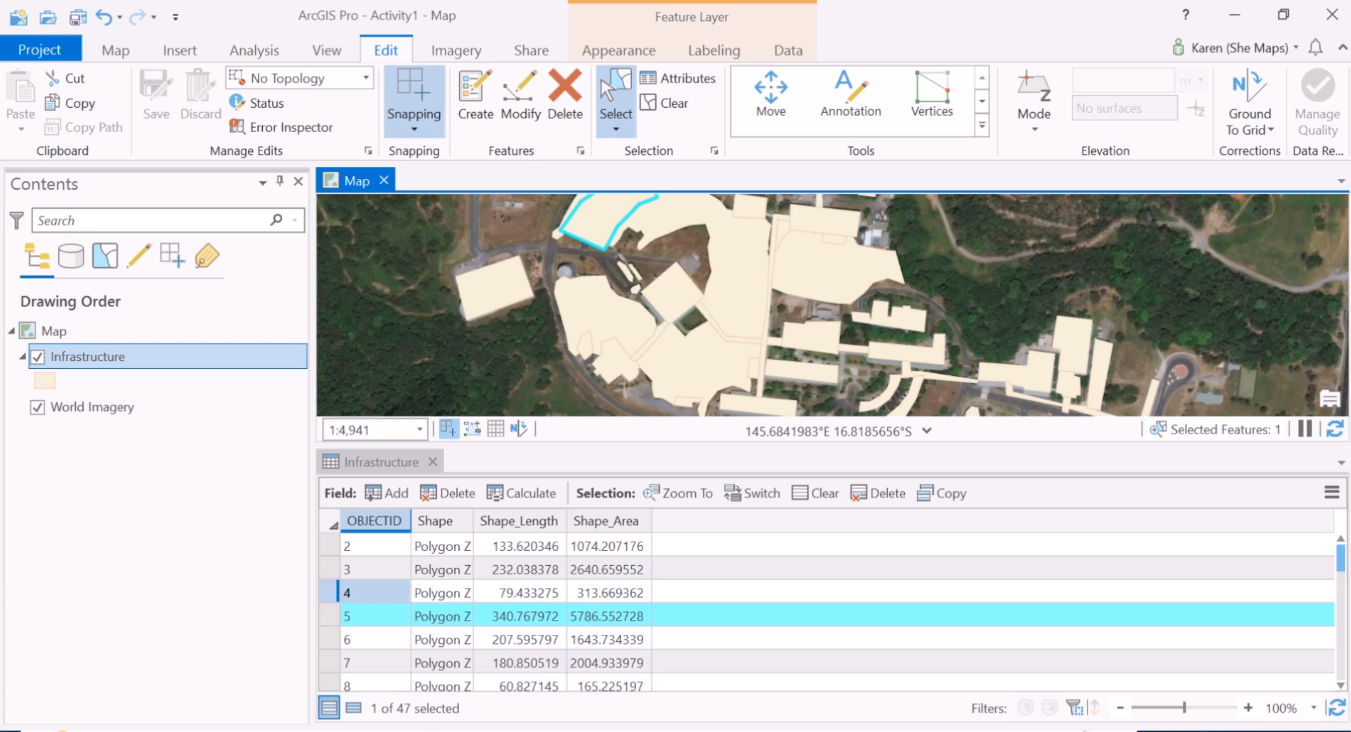
The Basics of Editing in ArcGIS Pro
This article discusses what editing in ArcGIS Pro means and how editing functionality is different from ArcMap. What does editing mean in the context of ArcGIS Pro? The term “editing” in the context of ArcGIS Pro relates to changing the attribute information or...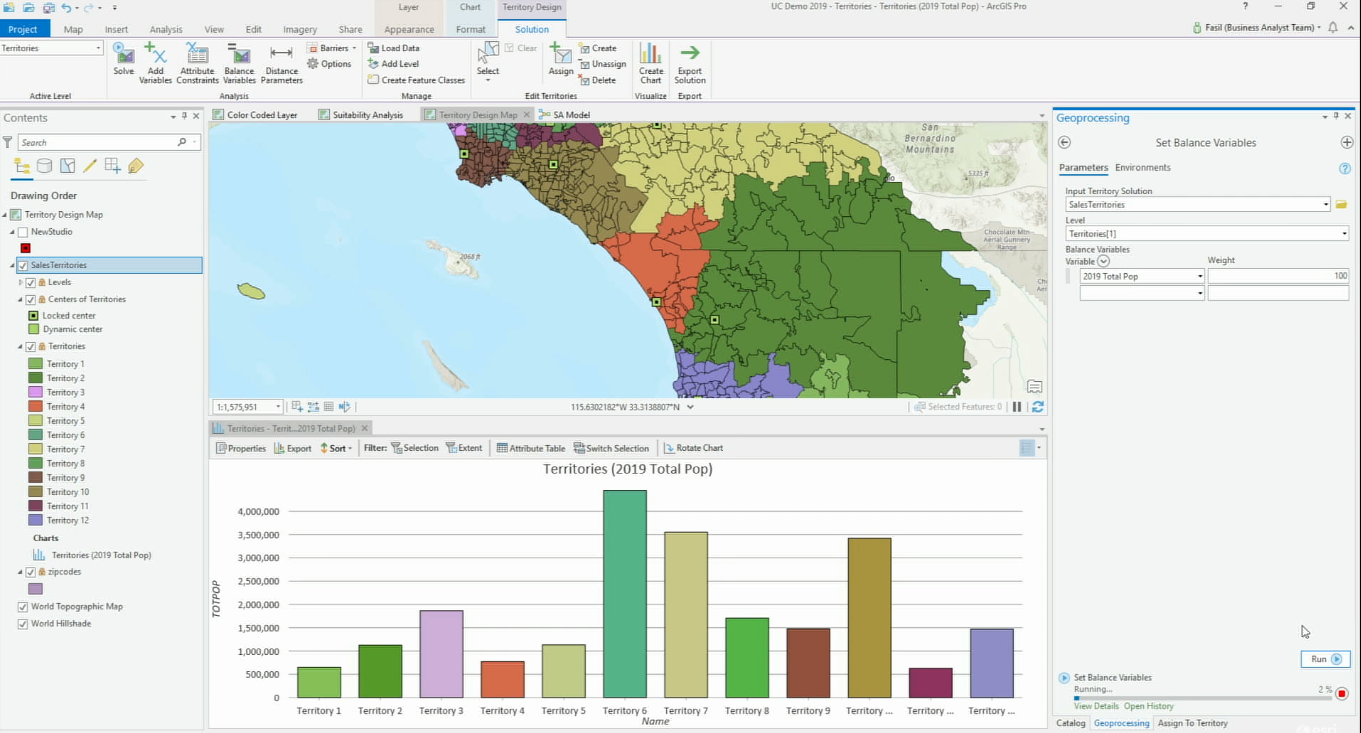
ArcGIS Business Analyst for ArcGIS Pro
ArcGIS Business Analyst for ArcGIS Pro gives users access to location data and advanced spatial analytics techniques, that help businesses do market analysis and communicate the results inside their organization through infographics and reports. ArcGIS Business...