Creating Interactive Selection Sets in ArcGIS Pro: A Comprehensive Guide
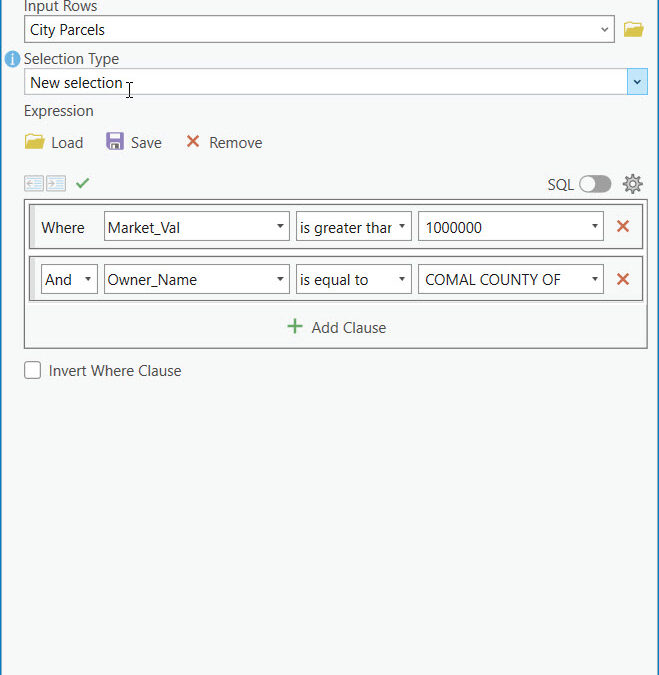
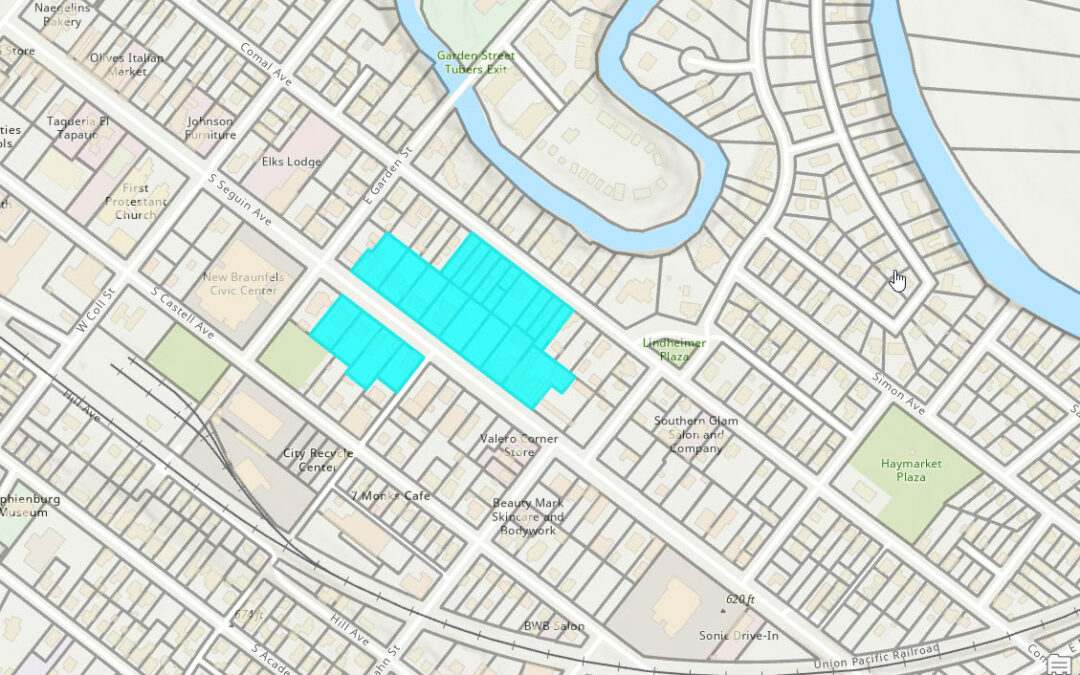
Check out our upcoming in-person ArcGIS Pro training in Denver, Billings, MT and other locations. Introduction For GIS professionals the ability to efficiently select and analyze subsets of data is crucial. ArcGIS Pro offers robust tools for creating and managing...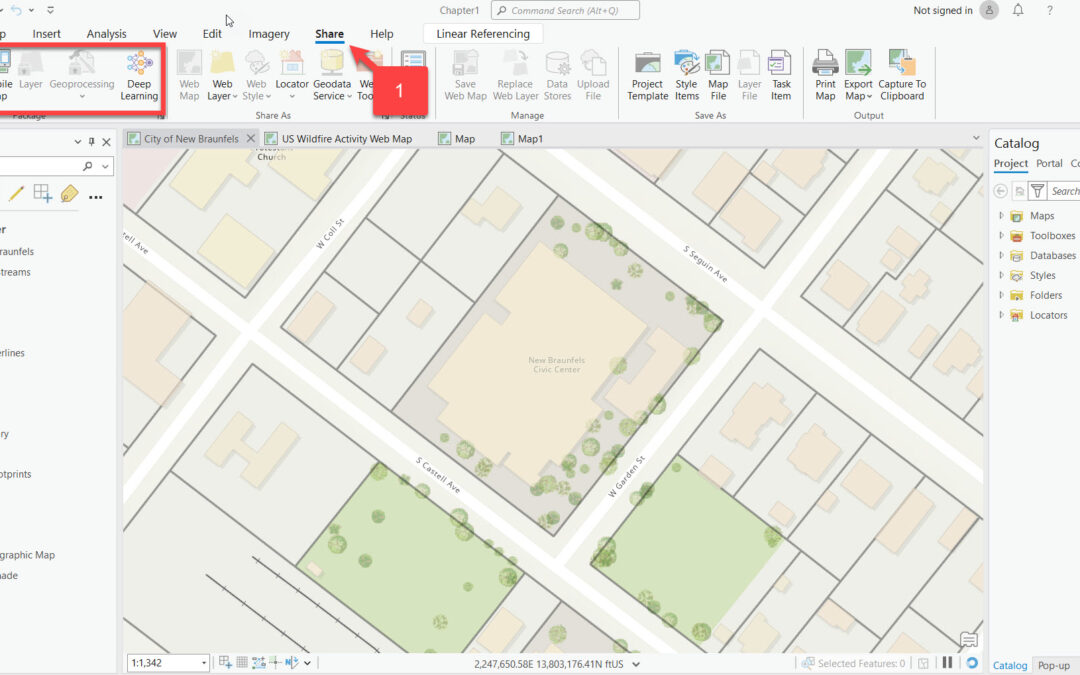
ArcGIS Pro Packages Explained: Simplifying Geographic Data Distribution
The efficiency and effectiveness of spatial data management is paramount to GIS professionals. ArcGIS Pro offers versatile and powerful features known as ‘packages’, designed to streamline the process of sharing and managing geographical data. This...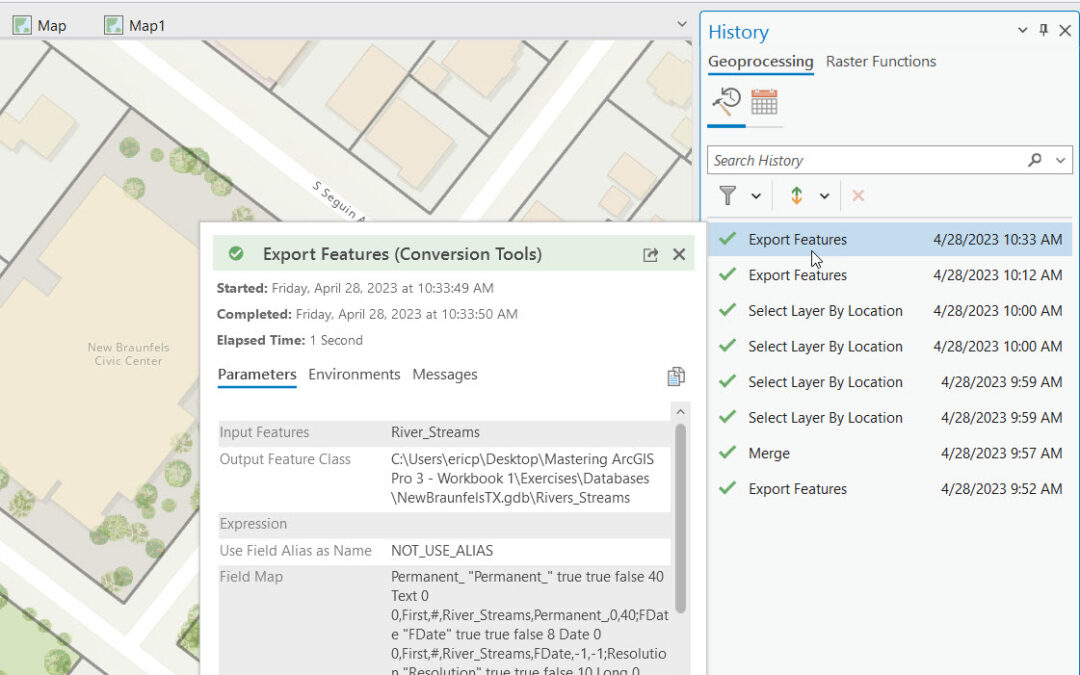
A Closer Look at ArcGIS Pro’s History Pane: Maximizing Workflow Efficiency
Introduction ArcGIS Pro offers a range of innovative features, among which the History Pane stands out. This article focuses on the functionalities and importance of the underutilized History Pane in ArcGIS Pro, highlighting how it enhances GIS workflows and project...