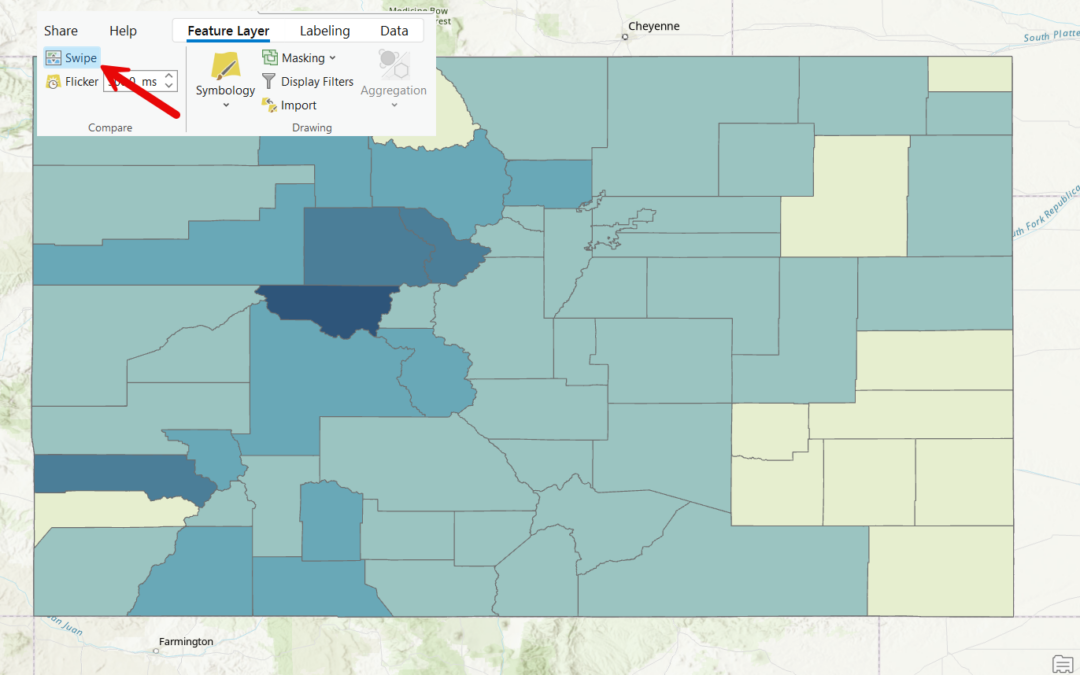
Discover the ArcGIS Pro Swipe Tool: A Game-Changer for Layer Comparisons
Don’t forget that you can save 20% on our self-paced, live-online, and in-person GIS training through December 31st by using the discount code 20for20. Discount already applied to the Annual GIS Training License. GIS is all about visualizing and analyzing...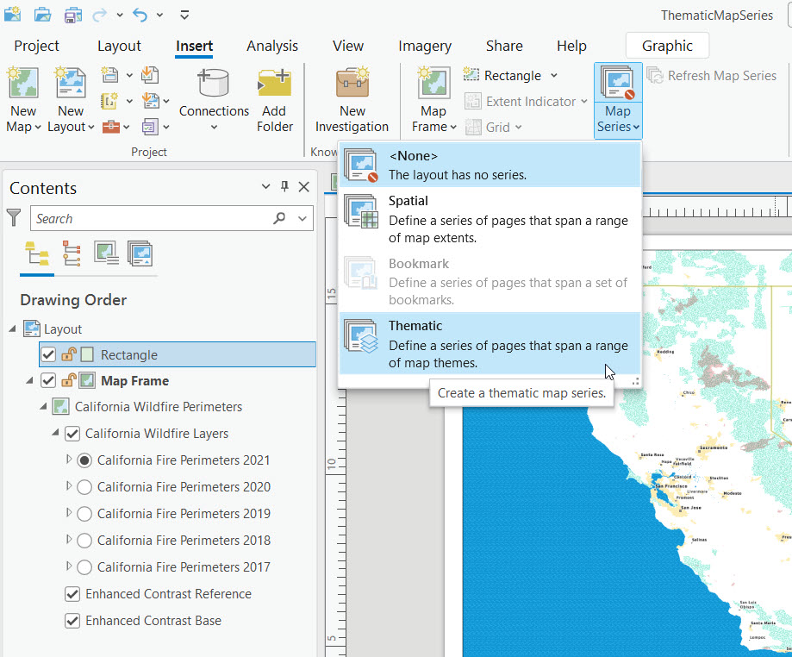
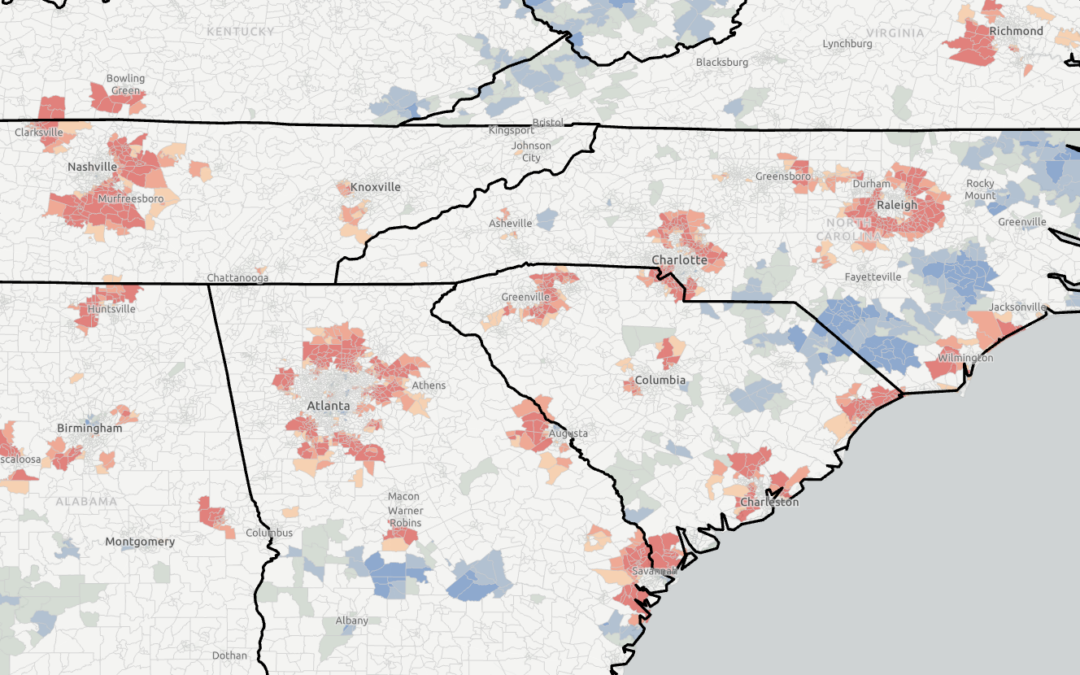
Step Up Your Mapping Game: Creating Thematic Series in ArcGIS Pro
Save 20% on our GIS classes during our annual holiday sale through December 31st. Simply enter the discount code 20for20 when checking out online. Discount already applied to the Annual GIS Training License. View our full catalog of classes and bundles. When it...
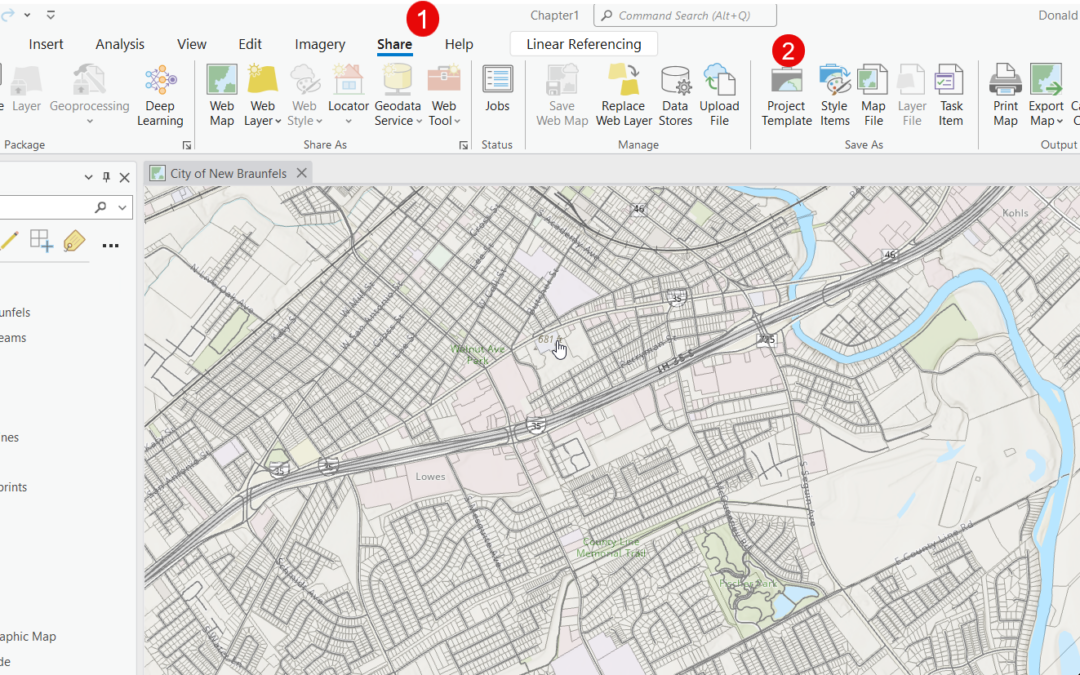
Exploring the Latest Updates in ArcGIS Pro 3.4
Our Annual Holiday Sale runs through December 31st, 2024. It’s also our 20th anniversary as a company! Enter the discount code 20for20 to save 20% on our classes. Discount already applied to the Annual GIS Training License. ArcGIS Pro 3.4 is here, bringing a...