
In this tutorial, we’ll learn how to configure and display simple pop-ups for feature layers.
In Pro, pop-ups can be configured to display information about individual map features. Rather than statically displaying this information on a map, the user can click on a feature and a pop-up will be displayed next. Pro lets you configure and display popups easily, so knowing how to use them will improve your mapping skills.
In this tutorial, we’ll create a simple map showing all major cities in California. Using proportional map symbology, we can compare their relative sizes in a single view. However, by configuring interactive popups, we can provide the map user with more specified information for each feature, such as placename, population counts and more.
You’ll learn the following skills in this tutorial:
- How to load a dataset in a new project in Pro
- How to create a selection from that dataset
- How to apply map symbology and draw proportional symbols
- How to configure and display pop-ups
STEP 1: Load the data
Again, we’ll use the Natural Earth quick start kit, that is for download here. If you don’t have the data already from other tutorials, download it on your local hard drive in a designated folder. Next, open Pro and create a new, empty project. Create a folder connection to the unzipped Natural Earth data folder and add the following two shapefiles to the map window:
- ne_10m_admin_1_states_provinces.shp
- ne_10m_populated_places.shp
When you add both files to the map, make sure the second one is placed on top of the first one, so you can see both points and polygons on the map. Both files are found in the 10m_cultural subfolder. The first file shows polygons for all states and provinces on the planet, the second one contains point features for major cities all over the world. We’ll now use the Select geoprocessing tool to create a selection of both datasets.
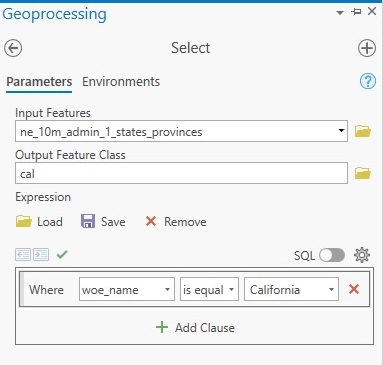
STEP 2: Create a selection of the data We’ll first select only the state geography of California. Open the Select geoprocessing tool and use the parameters displayed below. The state name is found in the woe_name column. Run the tool and de-select the input polygon layer to see only the state of California displayed on the map.
Next, we’ll select only the cities inside of California. Run the Select tool again, this time on the populated places point features layer using the following parameters:
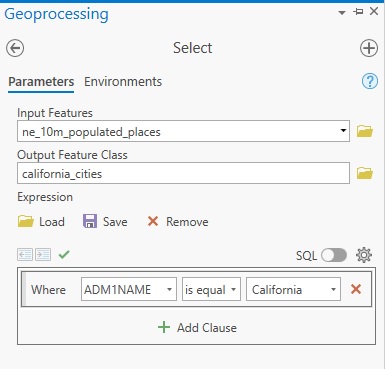
Run the tool and de-select the input feature layer with all points to see only the cities in California on the map. Again, make sure the point layer is displayed on top of the polygon feature layer to see both points and polygon. We now have all the data we need for creating map symbology and configure our pop-ups.
STEP 3: Use the map symbology tab for drawing proportional symbols
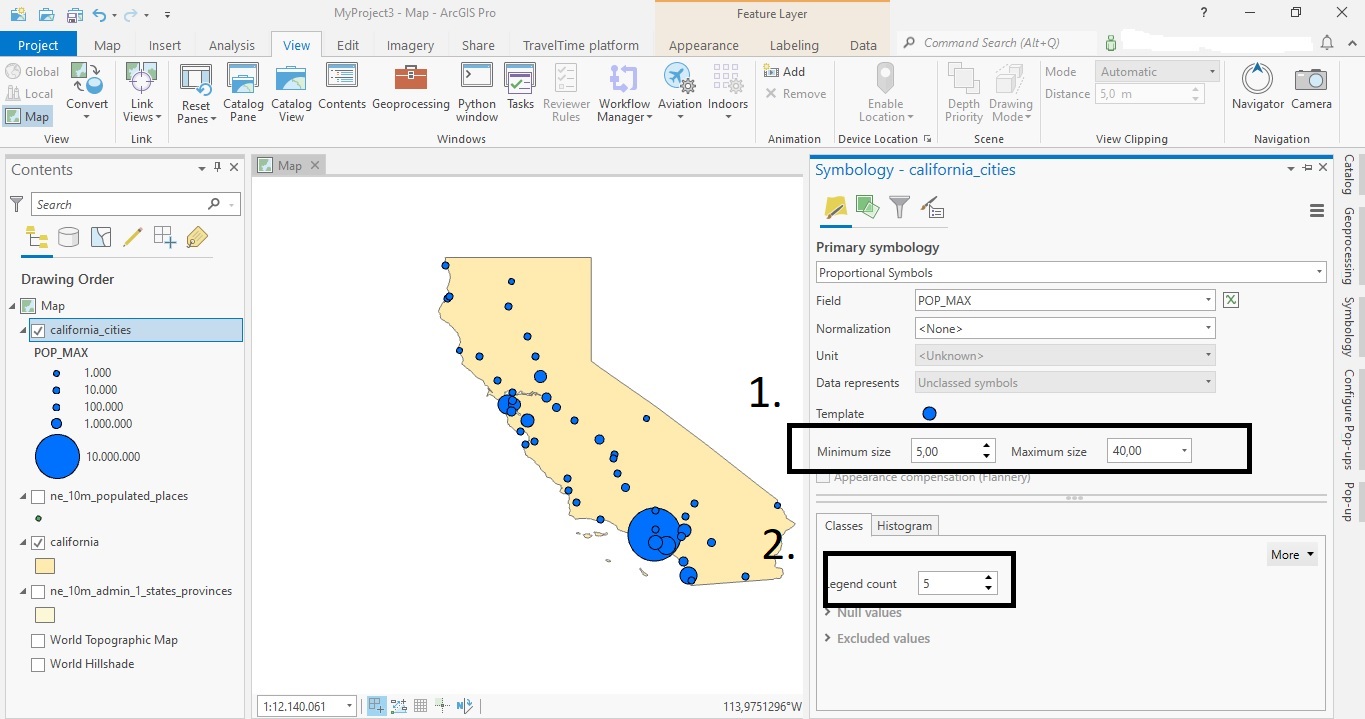
We’ll now create map symbology that enables to compare the size of each city, which looks better than using point symbols of equal sizes. This is done using proportional map symbols. Right-click the california_cities feature layer in the Contents pane on the left of the map and select “Symbology”. Under the “Primary Symbology” pane, choose “Proportional Symbols”, under Field, choose “POP_MAX”. This field contains population values.
Select a point marker and a fill color under “Template”. Next, choose the amount of classes under “Classes” (see number “2” in the image below) and set the minimum and maximum point size (see number “1” in the image below). Turn of the World Topographic Map and the World Hillshade layers in the Contents pane to see the exact map as displayed below. We now have a simple map of California showing all major cities using proportional symbology. We’ll now configure and display pop-ups for individual map features.
STEP 4: Configure and display pop-ups
Our self-configured pop-ups will display the city name and the population count. To do this, right-click the california_cities layer in the Contents pane and select “Configure pop-ups”. A configuration menu appears. First, change the field “{title}” to “{Cities in California}”. Click the “Back” icon (with an arrow pointing left) and double-click the “Fields” icon below the title. All fields from the attribute table will now be listed vertically. De-select all by clicking the “Display” field on top of the list. Next, individually select the following two fields: Name{Name} and PopMax{PopMax}. The first field contains the city name, the other field the population counts. Close the configuration menu.
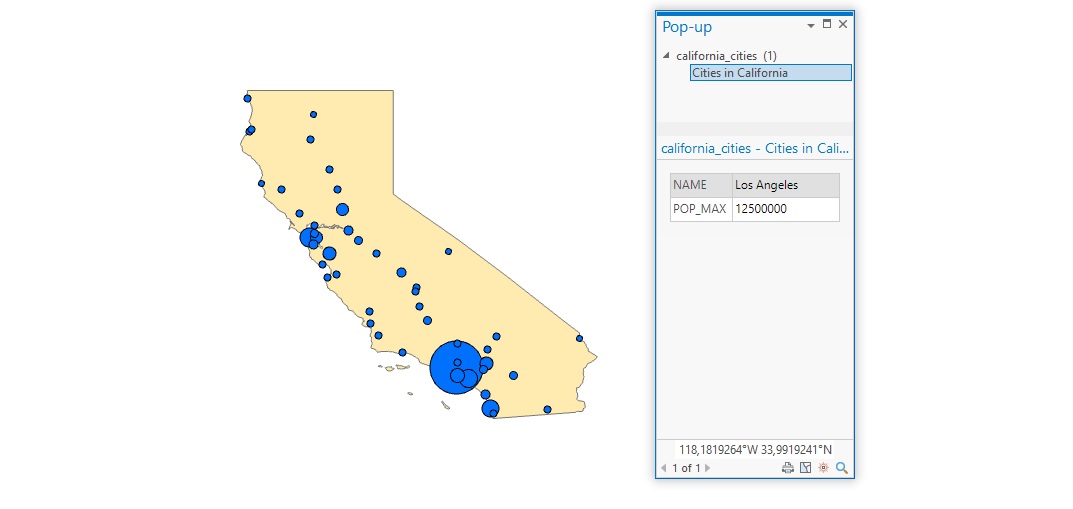
We’ve now configured the pop-ups, but they aren’t visible yet. To display them, click “Map” and next “Explore” on the ribbon interface. In the map above, the california_cities is the topmost layer. Make sure you have it listed as the topmost layer too by dragging it up, if necessary. Next, choose “topmost layer” under “Explore”. Now, if you click any blue point feature on the map, a pop-up will appear that shows both fields that were specified earlier, together with the name of the pop-up:
Learn more about creating ArcGIS Pro popups in our class ArcGIS Pro Short Series: Building Custom Popups.
