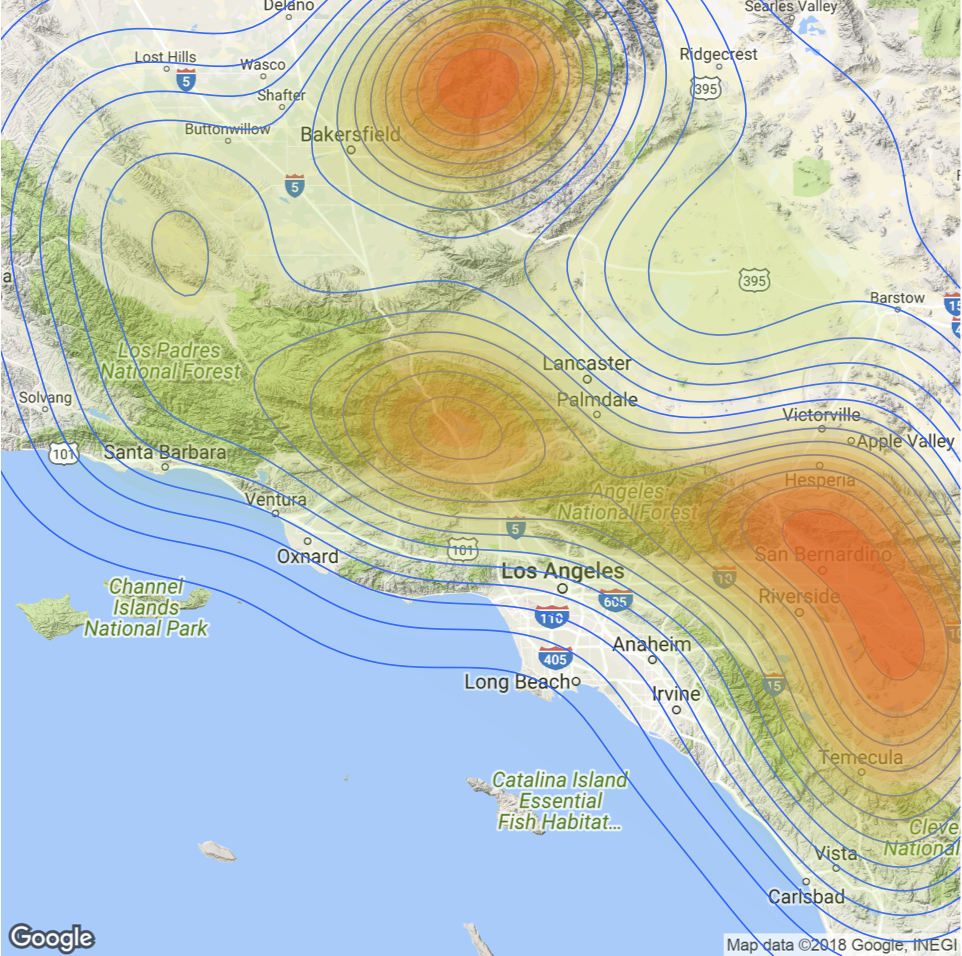
The ggmap package enables the visualization of spatial data and spatial statistics in a map format using the layered approach of ggplot2. This package also includes basemaps that give your visualizations context including Google Maps, Open Street Map, Stamen Maps, and CloudMade maps. In addition, utility functions are provided for accessing various Google services including Geocoding, Distance Matrix, and Directions.
The ggmap package is based on ggplot2, which means it will take a layered approach and will consist of the same five components found in ggplot2. These include a default dataset with aesthetic mappings where x is longitude, y is latitude, and the coordinate system is fixed to Mercator. Other components include one or more layers defined with a geometric object and statistical transformation, a scale for each aesthetic mapping, coordinate system, and facet specification. Because ggmap is built on ggplot2 it has access to the full range of ggplot2 unctionality.
In this exercise you’ll learn how to use the ggmap package to plot various types of spatial visualizations. Click here to view the entire exercise.
Learn more about using R for visualizing your data in our Introduction to R for Data Science 1: Programming and Efficient Data Management class.
You can also check out our Interactive Wildfire Viewing application, which was built using R and Shiny.

