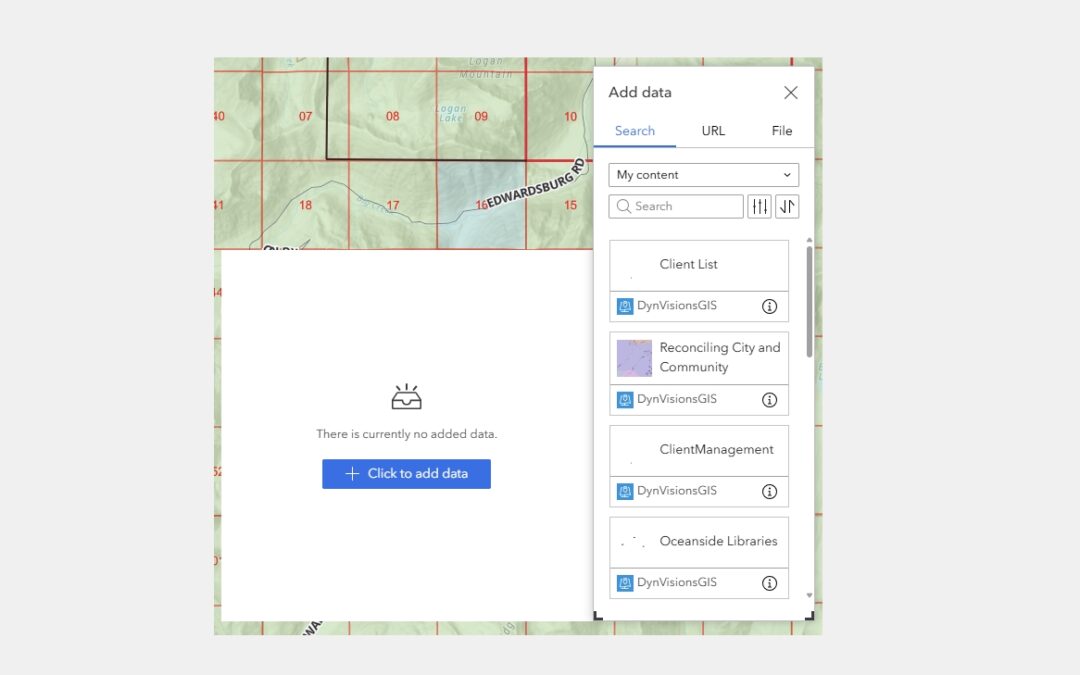
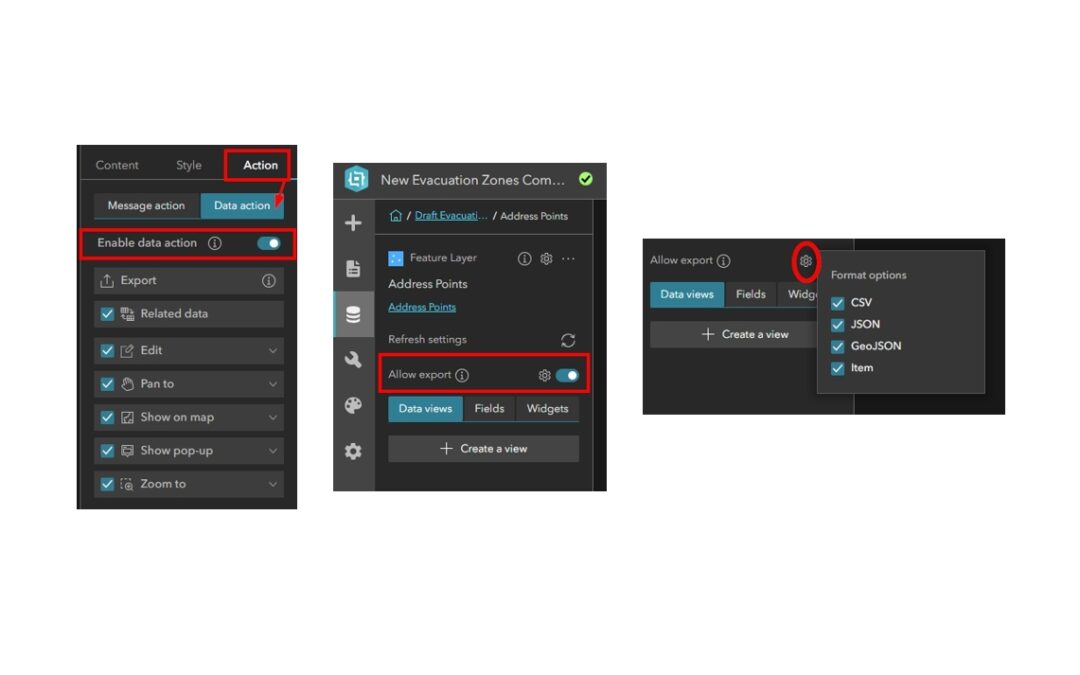
Exporting Data from Experience Builder: How to Properly Configure Hosted Feature Layers in ArcGIS Online
For upcoming Experience Builder courses, view our training schedule: GIS Training – Geospatial Training Services In many public-facing Experience Builder applications, providing users the ability to export data is a useful feature, whether for transparency,...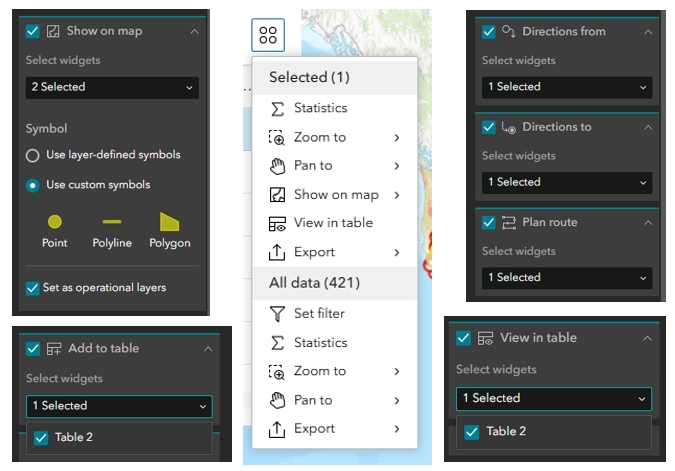
What’s New with Data Actions in Experience Builder
Since our last article on configuring data actions in Experience Builder, Esri has added several new data actions and expanded existing ones, providing even more functionality for end-users. This quick guide highlights what’s new and how you can use these capabilities...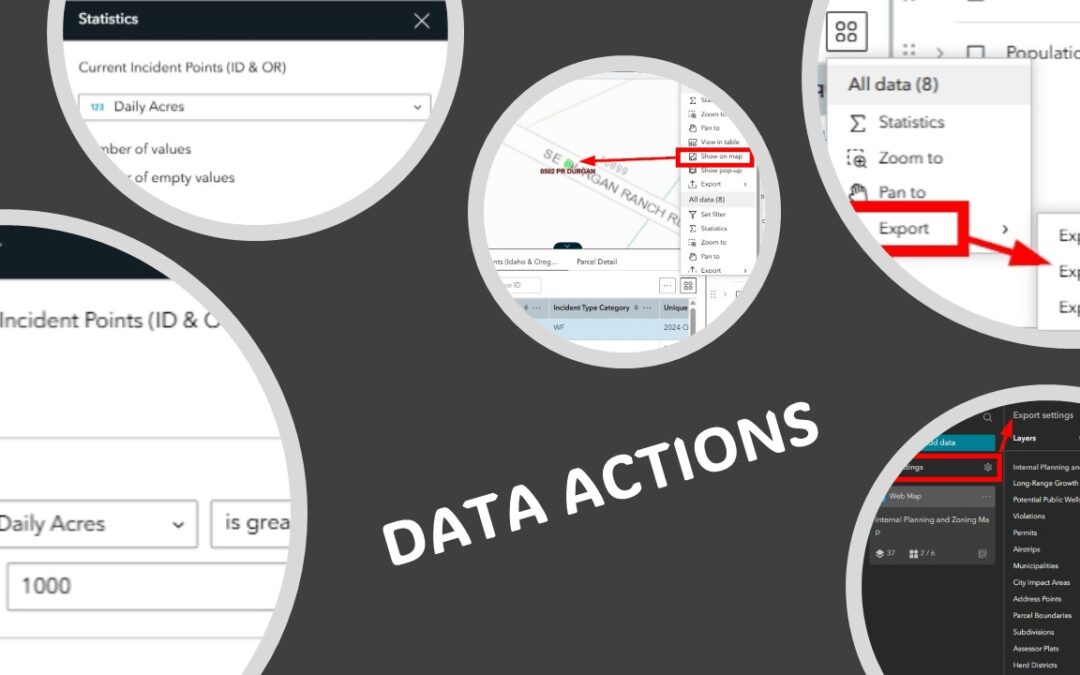
5 Data Actions To Enhance Your Experience Builder Applications
Click here to learn more and view our upcoming class schedule to participate in Experience Builder training. ArcGIS Experience Builder provides a powerful set of Data Actions that allow users to interact with data across multiple widgets. Data Actions are actions that...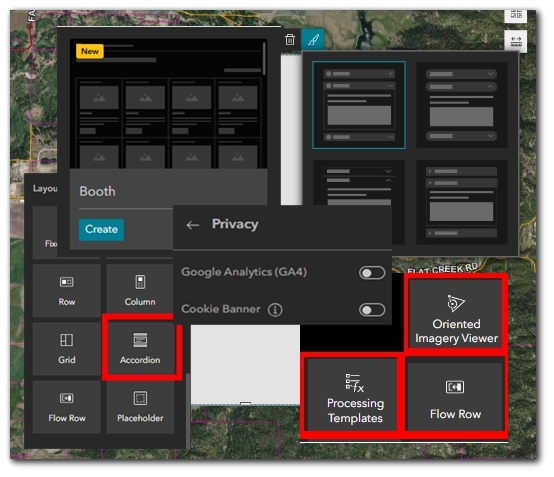
What’s New in Experience Builder: February 2025
Click here to learn more and view our upcoming class schedule to participate in Experience Builder training. ArcGIS Experience Builder’s latest update introduces a suite of enhancements designed to improve functionality, accessibility, and user experience....