Widget-Driven Design for Storytelling with Experience Builder
Storytelling in GIS involves creating engaging narratives that link spatial data with visuals and meaningful insights. Experience Builder offers a range of widgets to help users design interactive, visually compelling applications for storytelling. In this tutorial,...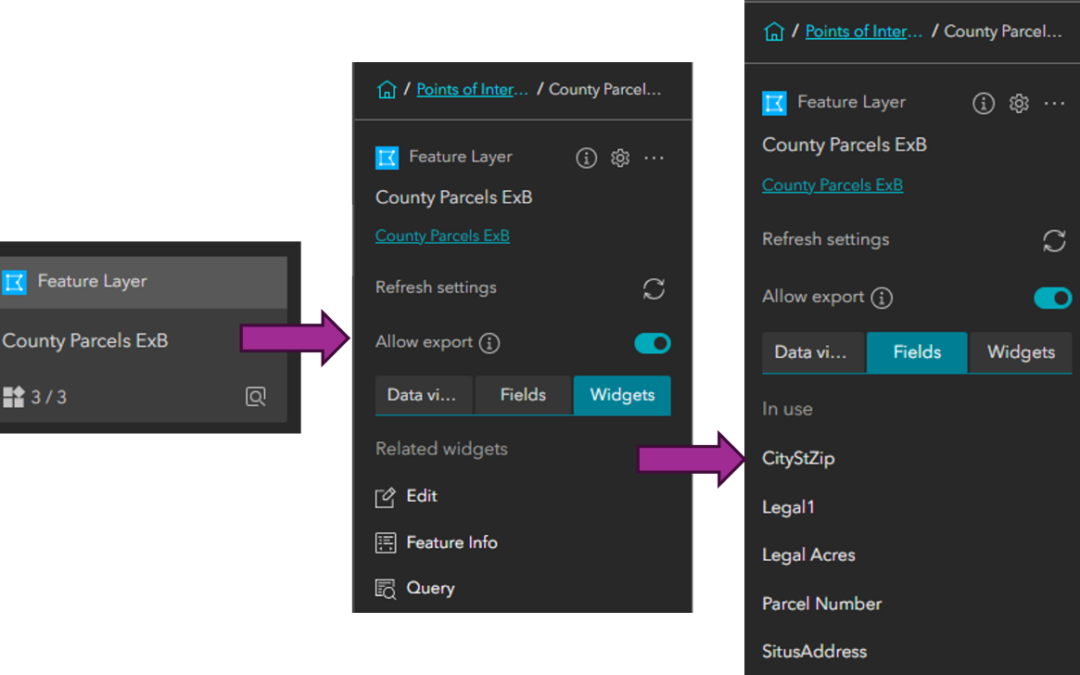
Demystify Experience Builder’s Data Panel: Meta Data for your App’s Structure
Learn more about our Intro to Experience Builder course and upcoming training schedule. It is perhaps true that Experience Builder’s data panel is off snoring in a corner somewhere. It is likely taking a nap until the next time you need to pull it up, which,...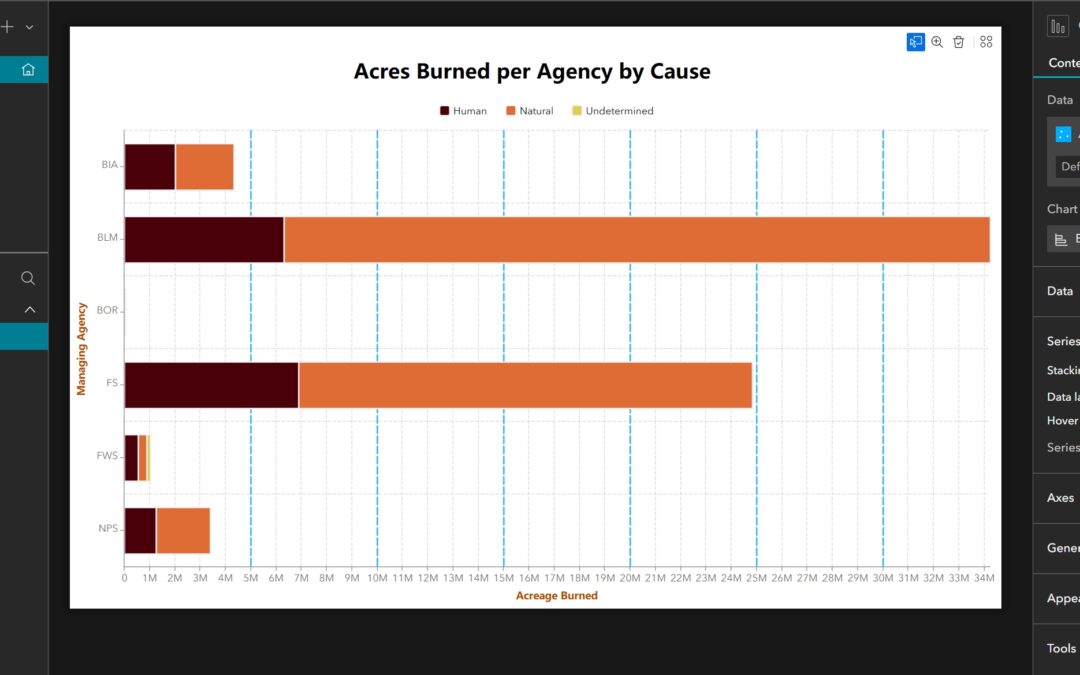
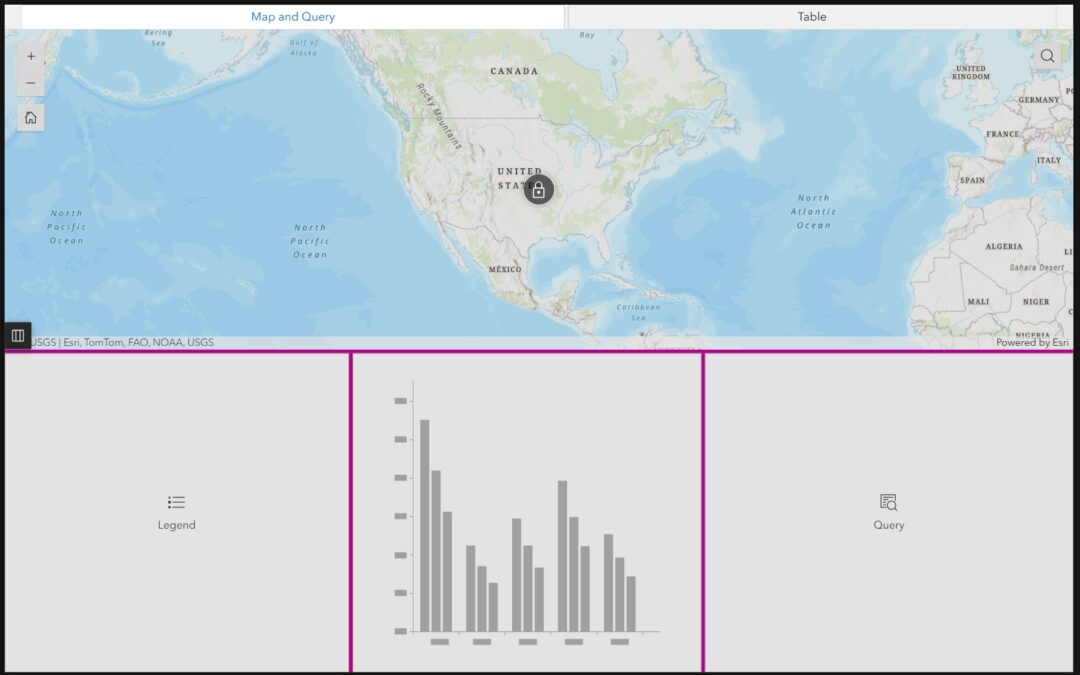
How to Customize a Stacked Bar Chart with a Split-By in Experience Builder
Learn more about our Experience Builder courses and upcoming training schedule. In a previous tutorial, we described the steps and options for configuring a modern pie chart in Experience Builder. In this tutorial, we will use Wildfire data from between 1984 and 2016...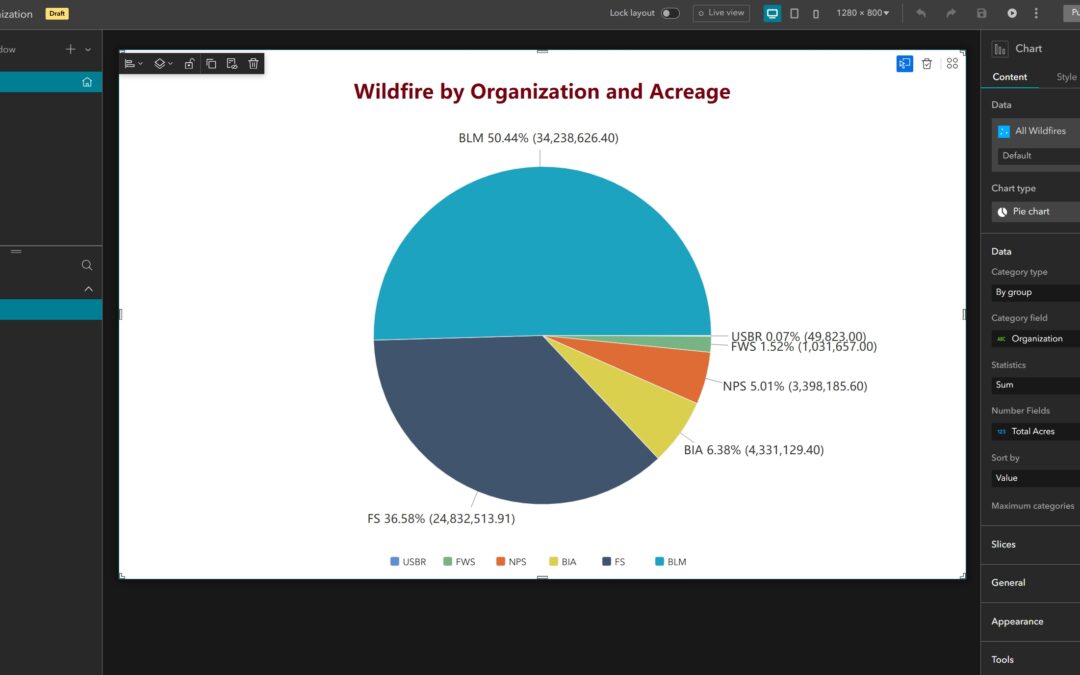
Advanced Pie Chart Customization in Experience Builder
Learn more about our Experience Builder courses and upcoming training schedule. Until recently, chart customization in Experience Builder has been lacking. Because of this, we often recommended embedding an Operations Dashboard in an Experience Builder application...