
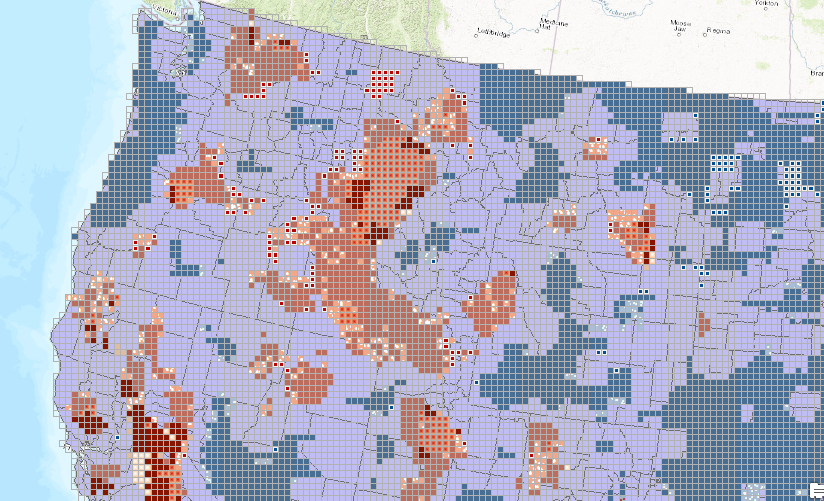
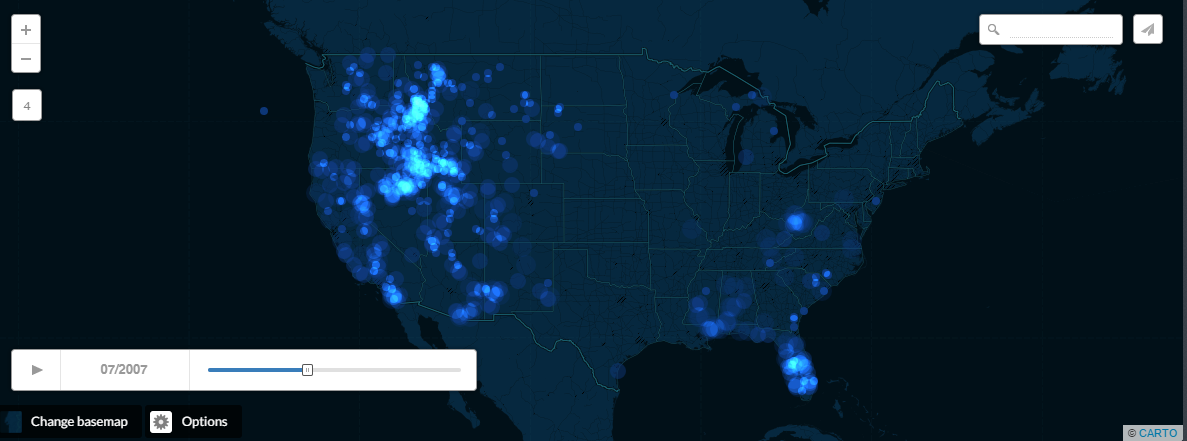
Time Lapse of Wildfire Activity in the U.S. – 2002 through 2016
In previous articles I have described the use of spatial analytics in wildfire activity from the year 2002-2015. Using this same dataset and Carto with Torque I have created a time lapse of wildfire activity in the U.S. from 2002 through 2015. Need help with a...