
In this tutorial, we’ll show how you can use a Spatially Enabled DataFrame (SDEF) in ArcGIS Pro to easily convert feature classes back and forth to pandas dataframes.
Esri’s ArcGIS API for Python introduced the Spatially Enabled DataFrame, an object to manipulate geometry and attribute data. In this tutorial, we’ll use this data object to convert a feature class so that it can be manipulated using the pandas library. After some data filtering, we’ll covert it back to a feature class and display it on the map in Pro. We’ll do this using an ArcGIS Notebook in Pro. All code from this tutorial can be run within a Python Notebook inside Pro without having to install any additional libraries.
STEP 1: Set up the Python Notebook and download the data
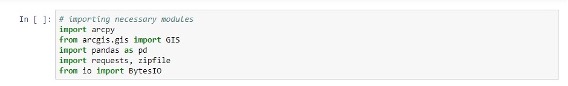
Open a new, empty project in Pro. A new Python Notebook is created selecting “Analysis” on the ribbon interface and clicking “Python” – > “Python Notebook”. This tutorial uses a single shapefile from the Natural Earth quick start kit. You can either download the dataset using the url provided above and unzip the downloaded file on your hard drive, or use the code snippet posted below that will do this for you. First, use the following code snippet to load all the necessary Python libraries for this tutorial:
To have Python download and unzip the data for you, use the following code snippet:
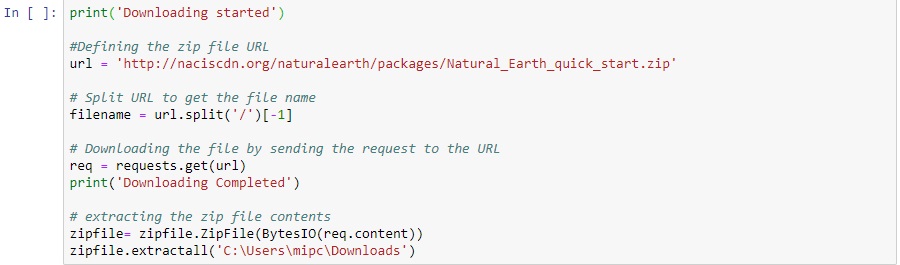
The last line of the snippet above contains the folder where the downloaded zip file will be unzipped. The notebook will display a message when the download starts and ends.
STEP 2: Reference the feature class and create a Spatially Enabled DataFrame
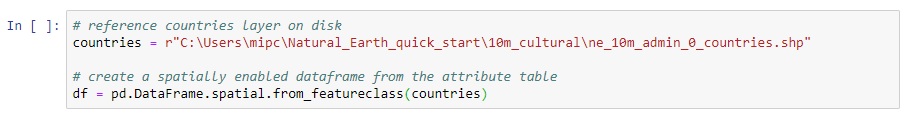
With the data located on our hard drive, we can now reference a specific shapefile and create a Spatially Enabled DataFrame (SEDF) from it using the arcpy and arcgis modules, using the following code:
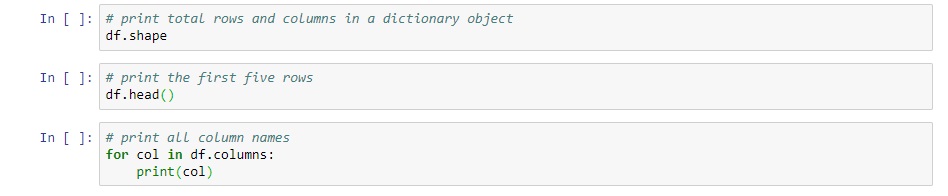
The countries variable now contains a shapefile with polygon data of all world countries. The df variable contains the SDEF, that looks like a copy of the attribute table of a feature class (or pandas dataframe), with one extra field named “Shape”, which contains information about the geometry of the data and its spatial reference. Now that we’ve converted the shapefile attribute data to the new format, we’ll use some basic pandas functionality to see what the data represent. Run the code below to be able to see the output for each:
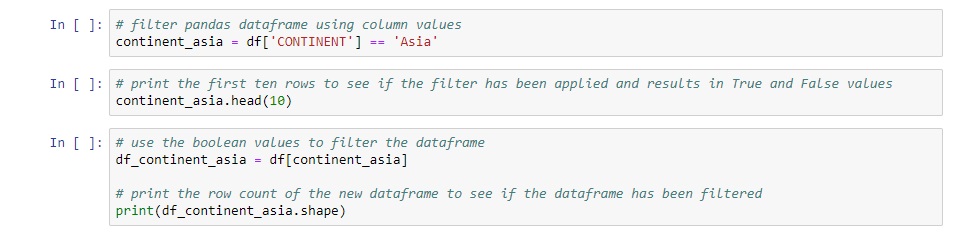
STEP 3: Use a pandas data query function to make a selection of the data
Let’s suppose we want a selection of that data based on the value of a column value, and covert that selection back to a shapefile. To do this, we can use a pandas query function to select the rows that meet our filter condition. For this tutorial, we’ll use the “continent” field and select only the countries on the Asian continent.
In the code snippets below, you can see that in the first cell we create a new variable that contains our filter condition. In the cell right below it, we can print the first ten rows of the dataframe to see if the filter condition has been applied for all rows correctly and shows both True and False values. In the third and last cell, the filter is applied to the entire dataframe, keeping only the rows containing True values. The row count should be less than before applying the query function. The row count after applying the filter is 59, whereas before that it was 255.
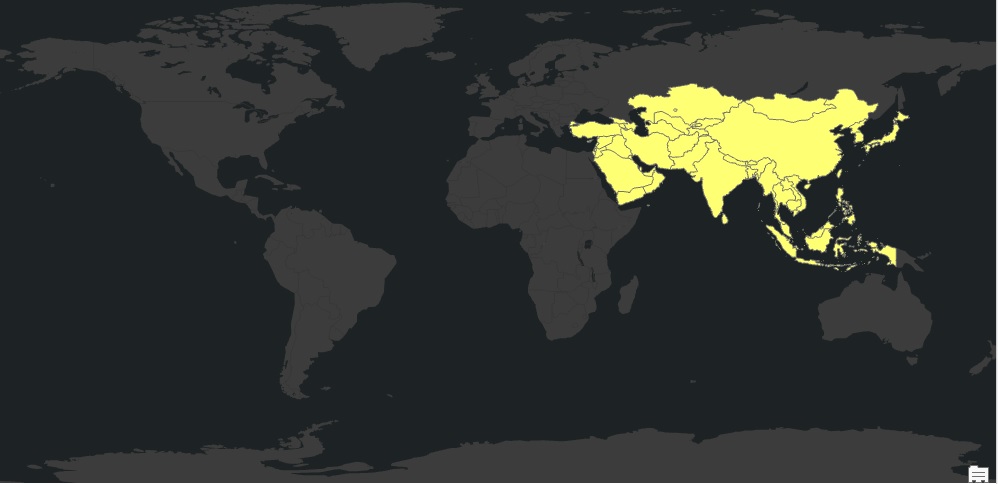
STEP 4: Convert the SDEF back to a shapefile and add it to the map
With only a single line of code, we can convert the SDEF back to a shapefile using the code snippet below. Notice that we use .copy() to make a copy of the pandas dataframe. This ensures that we have all the data from the pandas dataframe contained in the SDEF.

The shapefile is automatically added to the map window, showing only polygon features of countries on the Asian continent:
Did you know you can save up to 20% on any of our GIS classes? Through the end of December you can enter the discount code ‘holiday’ when checking out online. Discount already applied to Annual GIS Training License.
Live-Online Classes
Self-Paced Classes
Live, In-Person Classes
Training Bundles
