
In this tutorial, we will be working with gridded population data and learn how to calculate population totals for an area of choice: London Metropolitan area.
Gridded population rasters divide a geographical area into many equally sized rasters with a total population count for that area. In this tutorial, we will use a gridded population raster of the UK, that consists of more than 200,000 features (rasters). Each raster has a unique color that corresponds with the color ramp used for displaying the population counts.
Gridded population data is useful for calculating the total population for an area of choice, such as a city, district or coverage area for a shop or hospital. Even though the data is aggregated, which means that the count values are not exact, they give a reliable approximation of the population count of a small-sized area. In combination with Pro’s Overlay tools (Intersect/Erase), we can select population data for a smaller area and calculate the total population count.
STEP 1: Loading the data
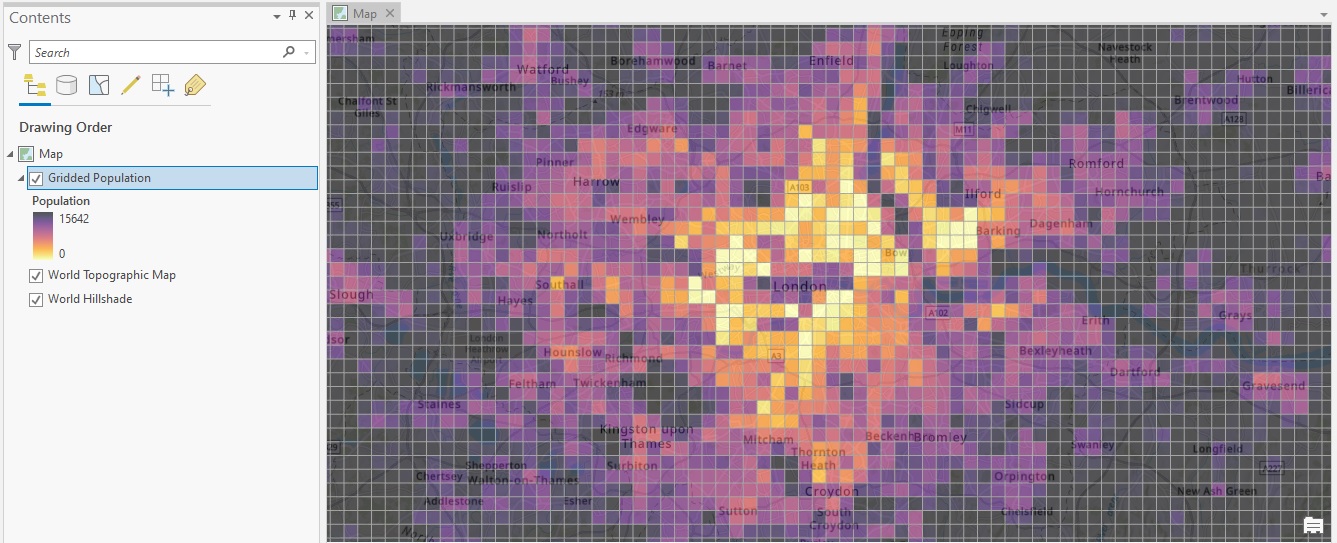
We will start with loading the raster layer named “Gridded Population” into a new, empty project in ArcGIS Pro. The raster file is a hosted feature layer found in ArcGIS Online. Pro will give a warning that the maximum number of features is reached when you try to display all rasters on a single map, but the individual features display fine when zoomed in. Zoomed in, this is how the raster layer looks for London, with some added transparency from the Appearance tab:
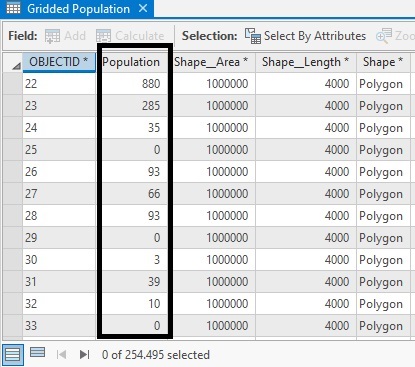
Opening the Attribute Table (displayed below), we can see that the Population column lists a total count for each raster. We will need this field when calculating total population count values.
STEP 2: Adding a boundary to mark an area of interest
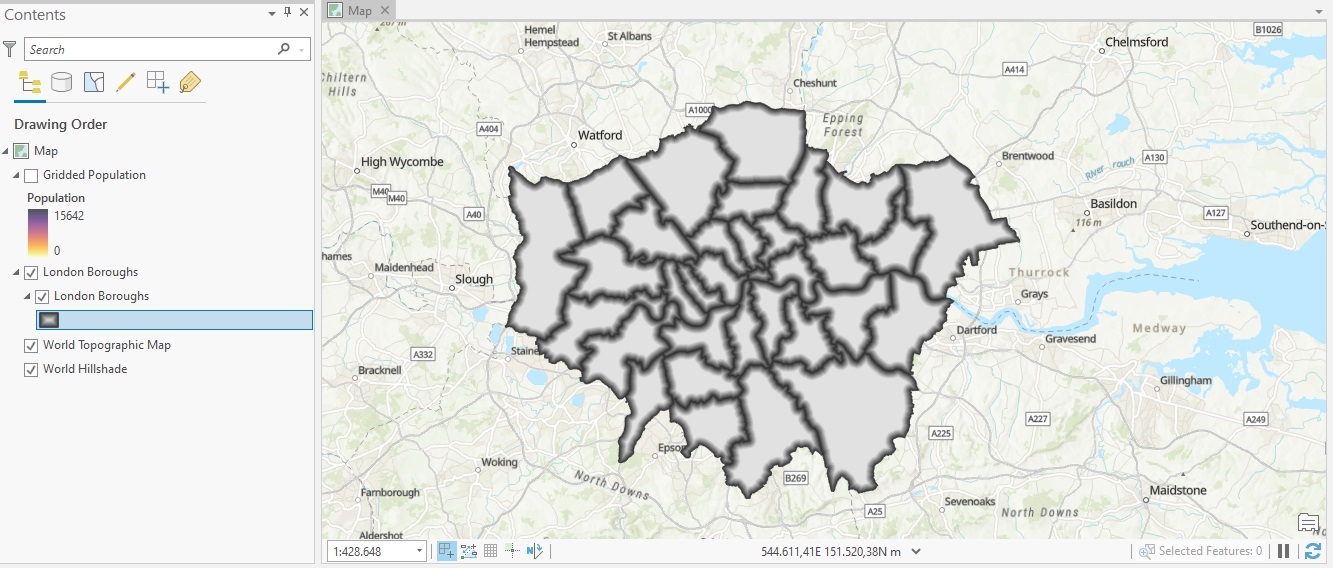
ArcGIS Pro offers a hosted feature layer of the different London boroughs, which we can bring into ArcGIS Pro, named London Boroughs:
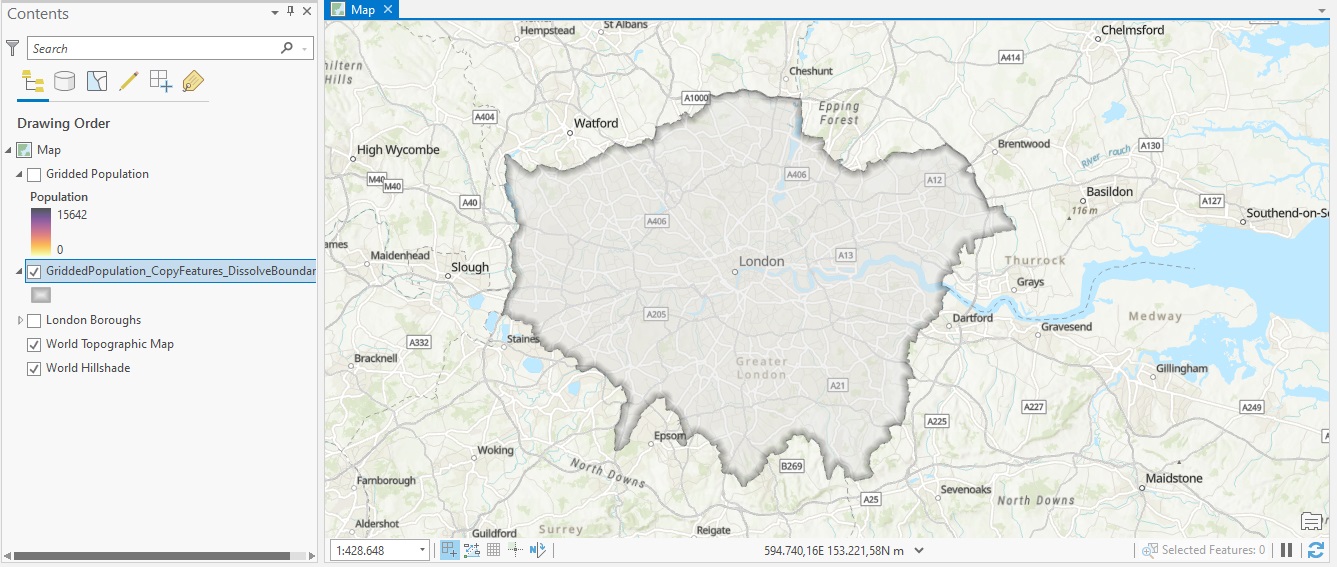
We can eliminate the boundaries for each polygon and merge them to one single polygon. This way, it is easier to calculate the population for the entire London Metropolitan area using the gridded population rasters later. This is done in two steps: first, by using the Copy Features tool as we cannot use the Dissolve Boundaries tool directly on a Hosted Feature Layer. Use the Copy Features tool on the London Boroughs layer and use the resulting feature layer as input for the Dissolve Boundaries tool. Mark the field ‘Dissolve by Field Value(s)’ and choose the ‘DESCRIPTIO’ field, as these are equal for all rows which is required to dissolve the individual features into one large feature. The tool output will be a single polygon:
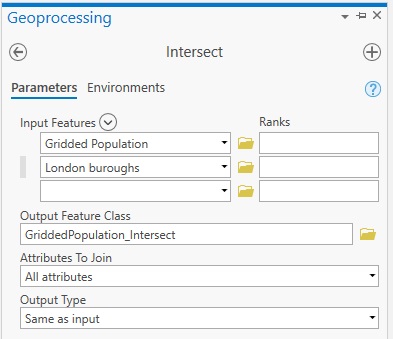
STEP 3: Apply the Intersect tool for the area of interest and raster file
To select only the rasters that fall into the London boroughs polygon we created in Step 2, we can use the Intersect tool and make an overlay of the two layers. Make sure you first select the Gridded Population first and the London boroughs polygon second as displayed in the image below. If you change the order, Pro will check if each of the more than 200,000 individual rasters intersect with the boroughs polygon. This will take hours and is completely unnecessary. Make sure the Input fields match the following image and click “run”:
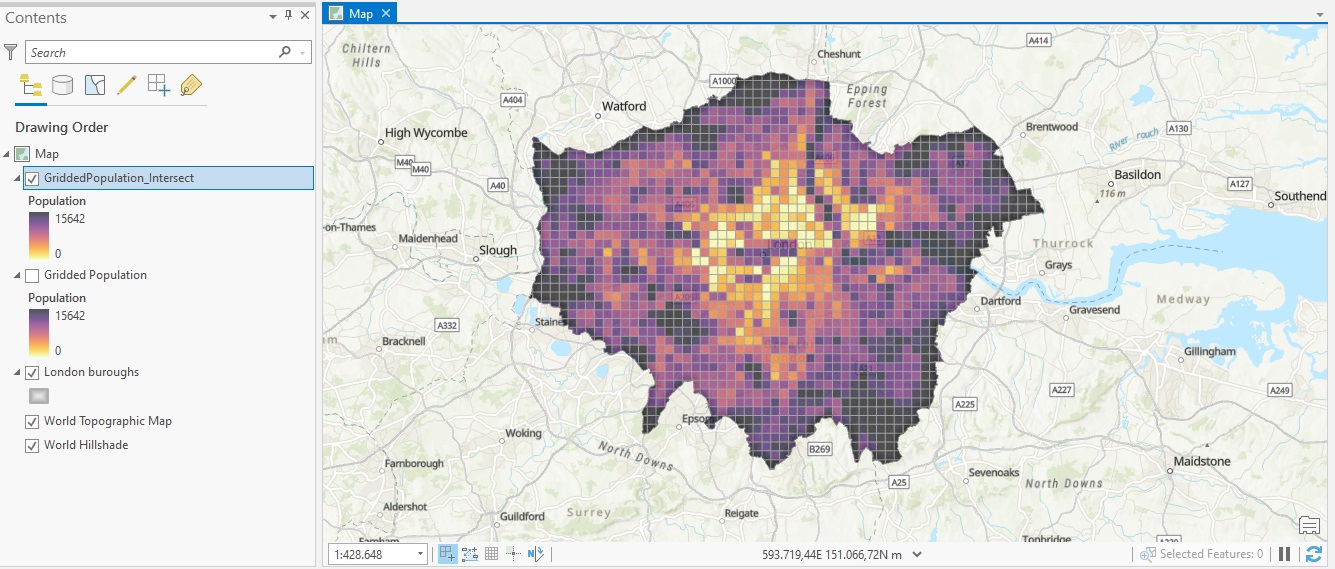
The result is a new polygon that only shows the gridded population data for the London Metropolitan area:
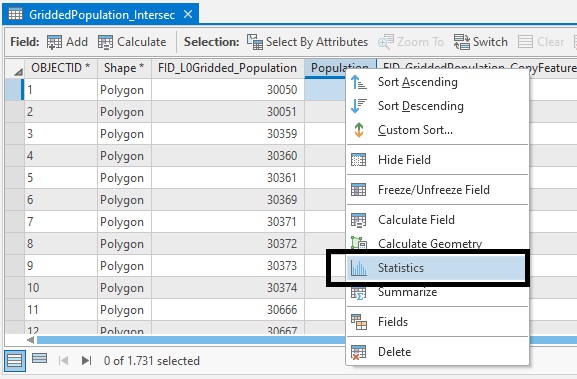
STEP 4: Calculating the total population value for the area of interest
This step is a little tricky as it requires some searching on the part of the user. We start by opening the attribute table of the newly created polygon by the Intersect tool under step 3. This attribute table shows the individual population counts for the rasters inside the London borough polygon. Pro’s ‘Statistics’ function (displayed below) will give you the sum value for the population field. You can access it by right-clicking the Population field column name in the attribute table and choose ‘Statistics’:
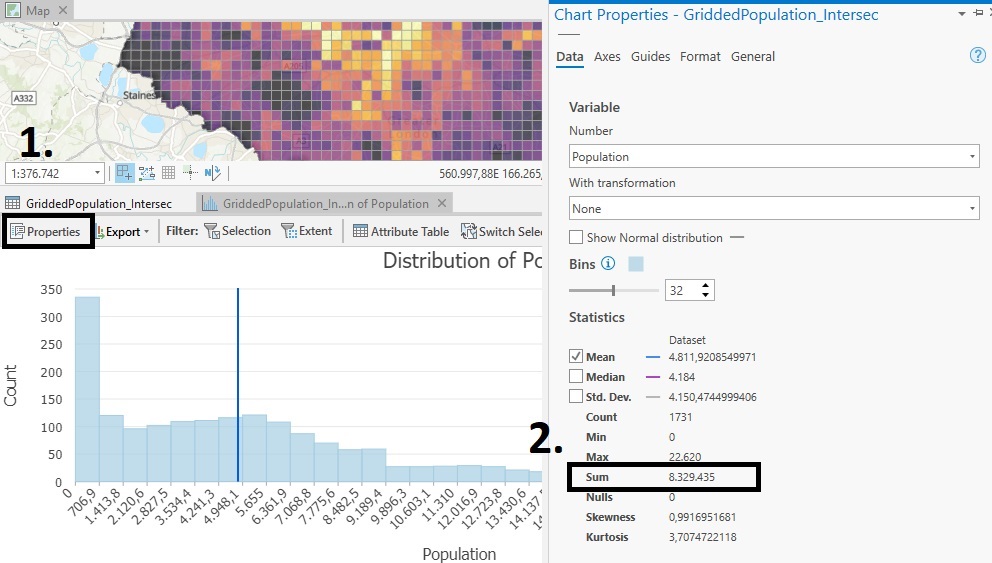
Next, a new tab will automatically open with the Statistics showing the distribution of the different values inside the Population column. In this tab, click “Properties” (1, see image below) in the top-left corner. A new menu opens named “Chart Properties”. Under the Statistics header, there is a SUM value for the population field (2, see image below), which is the value we are looking for and that represents the total population count for the London Metropolitan area:
You can calculate this sum value yourself by choosing “Calculate Field” after right clicking the Population field in the attribute table and create a new Field in the attribute table where you accumulate all individual field values using the expression listed below. The user-calculated population sum value will be listed in the ultimate cell of the attribute table for the field specified under “Field Name (Existing or New)”, as shown in the image below. Next, you only have to choose the right input table, choose a new field name (in this example, SUM was used), choose “Accumulate Value” from the helpers list and place the Population value inside it, so that it matches the following expression (1, see image below): AccumulateValue(!Population!). The code block below this expression is populated automatically by Pro and you can run it by clicking “OK”. The sum value matches that of the image listed above (2, see image below):

