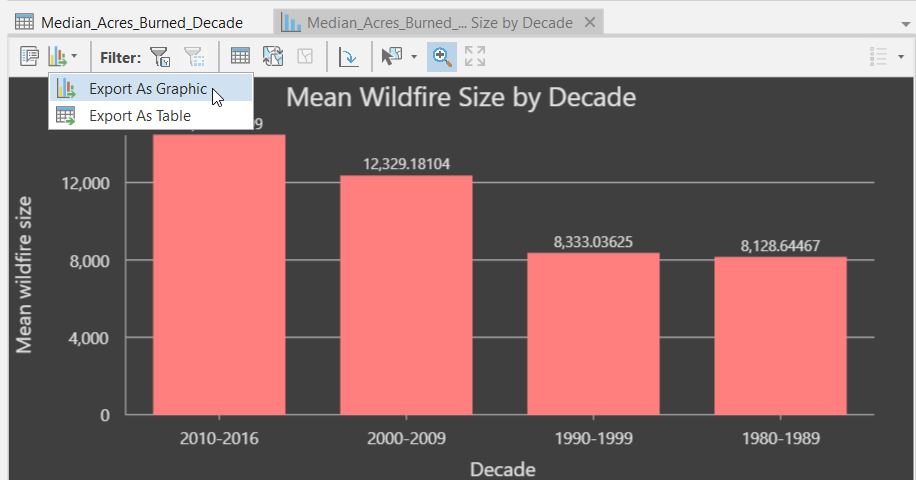
Charts can be created in ArcGIS Pro from tabular data as well as raster data. Tabular data includes feature data such as feature classes or shapefiles along with standalone tables. Raster data, including imagery and pixel data, can also be used as a source for tabular data. A chart is a graphical representation of data. Visualizing data through charts helps to uncover patterns, trends, relationships, and structure in data. Use charts together with maps to explore your data and help tell a story.
Our new ArcGIS Pro Shorts Series class Creating Charts and Graphs, which is also available through our Annual GIS Training License examines how you can create informative charts and graphs using ArcGIS Pro.
Below are a couple of recent videos that cover various topics related to working with charts in ArcGIS Pro. Visit our YouTube or Vimeo channel and click the Subscribe button to be alerted when we release new videos.

